TL;DR
- Error monitoring tools surface, prioritize, reproduce, and analyze bugs; front-end tracking is harder than back-end.
- Use a checklist: dashboards, APIs, commit tracing, metadata, integrations, and on-prem options.
- Review spans Sentry, Raygun, Bugsnag, Rollbar, TrackJS, Airbrake, LogRocket, Errorception, CatchJS; Sentry leads.
- Flatlogic chose Sentry; bonus Kuoll post‑mortem: session replay focus, $150k raised, pivot to e‑commerce, eventual shutdown.
Fact Box
- Sentry is the market leader in error and exception monitoring (Datanyze). Source
- Raygun pricing starts at $4 per 10,000 events/month (annual billing).
- Sentry pricing: Developer free; Team $26/mo; Business $80/mo; Enterprise custom.
- LogRocket Team: $99/mo for 10,000 sessions and 5 team members.
- Rollbar plans range from $49/mo to $599/mo; free personal project available.
If you’re a developer, one of your least favorite parts of your job is fixing bugs. Digging through thousands of lines of code and ping-ponging with users may be stressful. It doesn’t have to be that way, though. This article describes error monitoring tools: no longer have to rely on users to report issues. With these tools, you’ll be able to focus on the important stuff: writing high-quality code.
For me, this article will be somewhat personal. Before I came to work at Flatlogic, my partner and I tried to develop a service for searching and monitoring errors in web applications. So I’m quite sure I have studied all the pros and cons of certain services to a good extent.
This personal account sets the stage for an in-depth analysis of the JavaScript error tracking tool market, outlining its evolution, key players, revenue models, and evaluation criteria. Concluding with the firsthand experience of developing Kuoll, it offers valuable insights into the challenges and considerations unique to this niche, providing lessons for others in the field of business software and web application development.
What Are Error Monitoring and Its Goals?
Error monitoring and Error tracking tools are a set of instruments to proactively find, triage and fix errors in different applications, mostly on the web.
There are two ways of error monitoring – backend and front-end. Front-end javascript error monitoring is much more difficult than back-end monitoring: it depends on many components of UI glitches, connection problems, user’s hardware, slow performance.
The goals of the error monitoring tool are:
- Proactively finding and reporting errors;
- Identify critical errors and mute garbage errors;
- Reproduce errors;
- Provide analysis of the errors in your app.
The Market of Error Monitoring and Error Tracking Tools
First players in this market appeared in the early 2010s. Back then it was obvious that web technologies would soon dominate the application market, and companies were moving businesses to the cloud. The idea behind these tools is to make it easier to find, report and fix bugs in web applications, both front-end and back-end. An additional motivation to use these applications was natural and simple: saving money for companies, as these tools allowed them to quickly fix critical errors in the application.

Sentry was one of the first to create a full-fledged error monitoring service. The guys met at work at Disqus and created Sentry for their own local use at work, then rolled it out to open-source. The tool gained huge popularity, and customers soon requested a hosted version. This is how the Sentry we know now came about. The team initially chose the Python and Django niches.
At the moment, both the market and the tools are developing. There are already leaders who are lagging behind, as well as those who are not particularly developing. According to datanyze service, the market share is divided as follows:
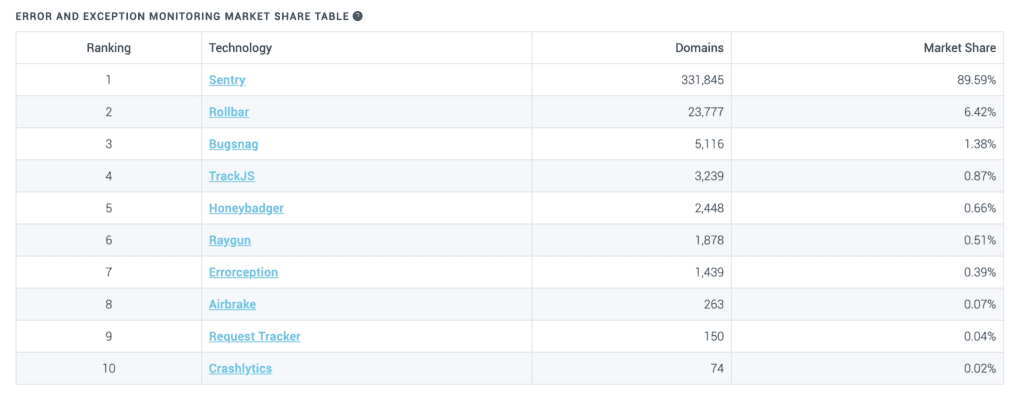
As you clearly see, Sentry is the market leader.
How To Evaluate Error Monitoring Tools
To understand if the tool is any good for error monitoring, we recommend asking the following questions before trying to install the tool into your app:
- Does the tool have a good dashboard to analyze information?
- Does it have an API reference?
- Can you trace the problem with the help of a tool back to an individual commit (and commit author)?
- Does it provide additional metadata that helps make it more meaningful?
- How much integration does it provide out of the box?
- Does it have an on-premise option?
If the tool does satisfy all – or at least most of these questions – feel free to try it out.
Best Error Monitoring and Error Tracking Tools
One important thing before we start: we will review the tools based on their functionality to detect bugs on the web because we are a company specializing in Javascript development (angular admin dashboard – is one of our favorite products).
Raygun
Overview
Raygun Error Monitoring is a powerful, user-centric tool that gives you actionable insights, not just clues. Raygun works across your full tech stack, from client-side and server-side, to desktop and mobile. Get peace of mind that you’ll be able to detect every error, wherever and whenever they might occur. You’ll have the power to dig down the line of code to diagnose what causes the issue, alongside rich contextual information to determine commonalities between users running into the same problem.
Main features/killer features
The three main features of Raygun are:
- Getting full stacktrace information and diagnostic details for every error occurrence or crash
- Filtering through your errors by, date, time, version, tag, host, OS, browser, custom tags and prioritize by number of users affected
- Displaying trends in errors, performance timings, user session traffic and more with customizable dashboards

Additional features
- All languages and frameworks support lightweight SDKs
- 180-day data retention
- Capture handled and unhandled exceptions
Supported technologies
Raygun supports almost all modern programming languages on the web and mobile. You can read the full list in their documentation.
Pricing options
Raygun has simple, flexible pricing that scales with you. Their rates are $4 per 10,000 events, per month billed annually or $6 per 10,000 events billed monthly. There are also volume discounts available for companies processing 10M+ events per month.
Onboarding, installation process, and dashboard
Raygun is easy to set up and integrates seamlessly with your current tech stack. You can sign up for a free 14-day plan, during which you can send an unlimited amount of data. Once signed up, you ‘activate’ your trial by sending data, which will flow information into your Raygun account in minutes. The workflow is simple, and it takes almost no time to get started.
Documentation
Raygun documentation is comprehensive, split out by language, product, and more. It’s a true hub of information for all things Raygun and will help you to navigate towards a more flawless application.
Integrations
Raygun has a large number of integrations, the most powerful of which I’ve listed below:
- GitHub: Connect specific errors and error groups to the exact line of code in your application, in one click. Move between Raygun and GitHub seamlessly.
- Jira: Raygun’s two-way sync with Jira means a faster error resolution workflow. Mark tickets as done in Raygun, assign tickets to team members, and protect your data with our OAuth option.
- Slack: Send error and performance alerts to a Slack channel of your choice. Resolve or assign alerts directly in Slack to reduce noise and respond to problems faster. One of our most popular integrations.
Conclusion
Raygun is a modern error monitoring solution for developers looking to get full visibility into errors across their tech stack, dive deep into the root cause, and save both time and money. Priced from just $4 per month, with support for every widely-used language, Raygun is a powerful and affordable option for software teams. Start your free 14-day trial today.
Sentry
Overview
Sentry is one of the first and the most popular error monitoring tools that is now becoming a platform, preferring to call itself an “application monitoring platform”. It has a big variety of features that help solve application issues.
Main features/killer features
The three main features of Sentry are:
- Breadcrumbs;
- Context;
- Releases.
Breadcrumbs show the events that lead to the error.
That means you can prioritize bugs by their impact on a business or users. Additionally, you can see the route cause of the error, so you don’t need to waste time debugging. Breadcrumbs are available both for Server Side and Client-side.
Sentry shows you everything you need to know to find and fix errors – the entire context. It can associate errors with the specific release. The context feature also provides full context on the environment of the error:
- Language;
- OS;
- Release;
- Environment.
Of course, you can set up a custom context.
And, finally, releases. With their help, you can see who and when caused the error. Releases provide additional context, including rich commit data, so you know which errors were addressed and which were introduced.
Additional features
- Custom queries;
- Source maps for JS and Node;
- Dashboard to analyze data;
- Stack trace;
- Cross-project issues.
Supported technologies
Sentry supports several technologies for web, mobile, and even games:
- All technologies around Javascript, including frameworks and particular libraries;
- Mobile – Android, and iOS;
- Desktop apps – MacOS, Windows, and Linux.
- Unreal and C for games;
- Web backend technologies – Python, Ruby, PHP, etc.
Pricing options
There are four pricing tiers:
- Developer – free, limited event volume;
- Team – $26/month;
- Business – $80/month, extended features;
- Enterprise – custom pricing, all features, and a dedicated manager.
There are also prepaid plans where you can extend the event’s volume.
Onboarding, installation process, and dashboard
There are several options to register in Sentry: social login or directly with an email. After you register, the system offers you to choose the platform you want to track. For example, if you choose javascript, Sentry will show you a code snippet to pass into your application. Thus the installation process requires several minutes.
After that, you will see quite an advanced admin with the statistics dashboard, projects, and other features.
Documentation
The docs are very advanced, well-designed, and work fast. They’re well grouped into blocks: Getting started, Platforms, API reference, Product, Data Management, Support, and others. The docs are very easy to use.
Integrations
Sentry has a huge number of options for integrating with other services. You can create a whole infrastructure for catching and correcting errors. Integrations are divided into blocks:
- Source code management (Github, Gitlab, and others). You can augment the errors with particular commits.;
- Deployment tools;
- Project Management tools (Jira and Asana). Assign bug fixes to the developers with the context from Sentry.;
- Notifications and messengers (Slack, Twilio). You can receive notifications about the errors right inside these tools. ;
- Data visualization (Datadog) – see and analyze errors over time.;
- Session replay tools (Fullstory and others). Get more context with video sessions.
- Authentication tools.
Conclusion
Sentry is a very advanced and complete tool with a lot of platform support, good documentation, and a lot of integrations. In our opinion, there are two main disadvantages with Sentry – design may scare enterprise clients; user session replay is completely absent.
Bugsnag
Overview
Bugsnag is a platform that, like others, allows developers to identify, prioritize and replicate bugs. Bugsnag helps proactively react to errors and prevent user distractions. Its main difference from Sentry is that Bugsnag isn’t open-source and has limited platform support.
Main features/killer features
- Instant notifications via several integrations with different chat apps;
- Specific diagnostics for JS frameworks;
- Cross-browser error grouping;
- Stackstrace and source maps support.
Additional features
- Breadcrumbs;
- Advanced error grouping and filtering.
Supported technologies
Bugsnag prioritizes error monitoring in mobile, but also supports web and server-side technologies.
- Mobile technologies – Kotlin, Swift, React Native, and Unity for Games;
- Web technologies – Javascript, Angular, React, Vue;
- Server-side technologies – Java, .NET, Node.js, Python, Ruby, PHP.
Pricing options
There are three plans – Lite, Standard, and Enterprise. Lite is $0 per month, Standard is $69 per month, and Enterprise has custom pricing. The main difference is in events volume and customization of the different features: for example, you can customize notification settings.
Onboarding, installation process, and dashboard
For the web, bugsnag installation is very easy: just copy and paste a snippet of code with your API key into your application or install it via NPM. The process is easy and smooth.
The dashboard is quite simple and gives less information than, for example, Sentry. You can filter errors by platform, release, stage, and severity. Additionally, errors are grouped by status. You can also assign the status manually. There is also an option to see statistics in the timeline dashboard.
Documentation
The documentation has a good user experience inside, divided by meaning blocks: Guides, API reference, Security, and Integrations.
Integrations
Bugsnag has a variety of integration options which are grouped by functions:
- Chat integrations – Slack, Flowdock, etc;
- Data forwarding – Splunk and others;
- Issue tracking – Jira, Asana, and more than 10 other services;
- Incident management – Datadog, Twilio, OpsGenie;
- Source Control – Github, Gitlab, and others;
- Integrations with SSO services.
Conclusion
Bugsnag is a very mature tool for reporting errors. It has a good track record of companies that use it.
Trackjs
Overview
Trackjs is a tool that has a specific niche of finding only javascript errors. The company has a great reputation among web developers due to its owners – developers themselves, that haven’t got any investments. The company bootstrapped themselves and stayed independent. The system is focused on simplicity in its design, and simplicity in its use: every web developer should be able to understand their bugs.
Main features/killer features
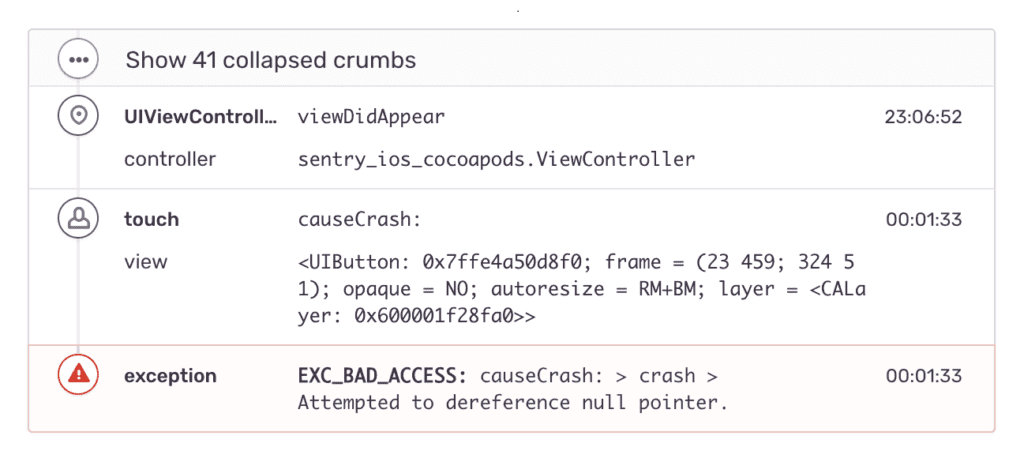
- Telemetry timeline. It shows you all network requests, application events, and user actions that lead to the error;
- Error Grouping with rules;
- Metadata dashboards.
Additional features
- Error Impact Reports;
- Error Trend and Analysis.
Supported technologies
The tool supports only javascript and front-end frameworks: React, Vue and Angular. It is at the same time an advantage and disadvantage. We think that the main disadvantage is that it does not support NodeJS, but some enthusiasts have done an open-source version of TrackJS tracker for NodeJS.
Pricing options
There are 3 plans to pay for TrackJS: Starter for $49/month, Professional for $99/month and Business, starting from $199/month. The price is fixed, no matter how many employees are using the tool, and varies on how many notification channels you have, as well as events coming into the system.
Additionally, if you are a non-commercial company or startup, you may be eligible for a free plan.
Onboarding, installation process and dashboard
You can register in TrackJS only via email, there’s no social login. After the sign up you will be offered to copy and paste code snippets into your application and start tracking errors.
Then you need to set up a team, notify/ignore error rules and environment/application names. The dashboard shows error statistics and groups them by browsers, time, URLs, and metadata.
Documentation
Documentation is easy to read and use. It has all the information required to use the software. In comparison with other instruments, though, it’s a bit limited.
Integrations
Out of the box Trackjs doesn’t have any integrations: you will need to do custom integrations with other tools using API reference.
Conclusion
TrackJS is a niche tool that only works with Javascript technologies. This is an advantage and a disadvantage. Looking from a moral point of view, it’s also a plus that the tool does not take investments and is managed by web programmers.
Rollbar
Overview
Rollbar is a mature tool for tracking errors in almost every platform out there, with a wide range of different features. It stands close to Sentry and Bugsnag. The company was started in 2012 by two engineers to help other developers to identify and fix bugs.
Main features/killer features
- Ability to trace errors back to the commit which introduced them: there is full integration with GitHub, Bitbucket, and GitLab. This information can be found via the dashboard, as well as via API, or by using RQL (Rollbar Query Language);
- Telemetry helps to retrace browser events leading up to errors;
- Instant alerts via popular tools like Slack, Pagerduty, and others;
Additional features
- Error grouping to reduce noise;
- Assigning errors to team members.
Supported technologies
Rollbar supports languages such as Ruby, PHP, Node, Python, and Java, as well as platforms such as iOS, and Android. Its main focus, though, is on Javascript and its frameworks.
Pricing options
Rollbar offers a range of plans in quite a flat structure. There is a free personal project. Paid plans start at $49 per month and go up to $599 per month for the premium plan. In addition to these, you can get a custom arrangement.
Onboarding, installation process and dashboard
The installation process is quite simple, just like in any other tool – just copy and paste the code snippet into the application.
On the application dashboard you can see following information:
- Top 10 issues in the last 24 hours;
- Top 5 active items in the last 24 hours;
- Top 5 active items in the last week.
Additionally, you can filter the report by the environment. You can look at a list of all items, viewing how many times they occurred, a 24 hour trend, the last time it occurred, which environment it occurred in, and the language.
Drilling down into an item shows you the entire history of that exception. You can see the browser, operating system, request method, request URL, and the exception message. The exception can also be linked to a version control system issue, allowing for it to be resolved and pushed through to deployment, with a full history.
Documentation
Documentation is built like a separate resource and has all information for effective setup and development of Rollbar. All features of the tool are described and easy to read.
Integrations
Rollbar integrates with most of the standard services, such as Slack, HipChat, Logstash, Mailgun, Jira, Trello, Sprintly, Help Scout, and PagerDuty. On each integration there are great guides on the Rollbar website.
Conclusion
Rollbar has an impressive offer for numerous languages and frameworks, but it requires some code changes to work.
Airbrake
Overview
Airbrake calls itself an application monitoring system that includes Errors, Deployments and Performance.
Main features/killer features
- Real-time alerts;
- Error aggregation;
- Custom filters to avoid noise.
Additional features
- Breadcrumbs;
- Error search;
- Error analysis.
Supported technologies
Airbrake supports a large number of languages and platforms, including Java, JavaScript, PHP, Go, Node, Swift, Magento, Django, .Net, and Ruby on Rails.
Pricing options
The pricing supports four options. The tiers start as low as $49 a month and go up to $249 a month. The product also provides an option for a 30-day trial.
Onboarding, installation process and dashboard
The installation process is easy and smooth – simple copying and pasting the code snippet into the application.
The dashboard data includes following things:
- The number of times an exception has occurred;
- The environment in place at the time the error occurred;
- A full backtrace;
- How many times an exception occurred since the last deploy.
Exceptions can be filtered by an environment, prioritized by error count, environment, and users. Airbrake makes it easy to turn exceptions into tickets so that they can be tracked through to resolution, and deployed to various environments.
Documentation
Airbrake’s documentation isn’t as extensive as other tools. But it still provides detailed setup instructions to get you started, regardless of your language or platform.
Integrations
Out of the box, the product has integrations with a range of standard services, including Bitbucket, GitHub, PivotalTracker, FlowDock, Campfire, Jira, HipChat, and others. In comparison with other tools, though, the number of integrations is low.
Conclusion
In contrast to other products in the article, Airbrake doesn’t appear as feature-rich. For example, whereas Raygun and Sentry support logins via Facebook, Google+, Twigger, and GitHub, Airbrake only supports GitHub.
Logrocket
Overview
Logrocket differs from other tools with its ability to record user sessions to get a better understanding of how exactly an error occurred.
Main features/killer features
LogRocket has some really cool features, including:
- User session video playback: You can literally see everything your user sees in real-time. You can replay a video of everything the user did that led to an error.
- IP Address and User-Agent Tracking: LogRocket keeps track of the IP address of each session, but it can also tell you which browser is being used. It is extremely useful for troubleshooting browser-specific problems.
- Action logging: You can see all the Redux actions fired by your application as well as the payload they were holding at the time they were fired.
Additional features
- Network request/response logging: You can see all network requests from the moment you navigate to a certain endpoint.
- Savable filters: LogRocket lets you insert custom properties (called User Traits) into your logs, letting you make key-value pairs that provide more info about your user or session.
Supported technologies
Logrocker works mostly with Javascript technologies. One of the special features is that it supports Redux error logging.
Pricing options
The first plan is Free: 14 day trial with access to all features and up to 1000 sessions. Each session is 30 minutes long, starting from the moment you use the LogRocket.init() function.
Next is the Team plan, with price depending on number of team members and sessions:
- $99/month for 10000 sessions, 5 team members
- $199/month for 25000 sessions, 10 team members
- $399/month for 100000 sessions, 20 team members
The final plan is Custom Pricing: you’ll have to talk to the team directly about the price.
Onboarding, installation process and dashboard
The first step is to sign up on LogRocket’s website. After creating a project name, you’ll receive a 6-character key to use with your project name as YOUR_APP_ID in your initialization setup in your app (see below). Once you’re ready to roll, you’ll start LogRocket by inserting two lines of code into your app.
Documentation
If you go to docs.logrocket.com, you’ll find that they have amazing documentation. It’s very thorough, able to answer many of your questions.
Integrations
LogRocket integrates with lots of other logging tools such as Sentry, Airbrake, Bugsnag. You can also integrate it with project management and analytics tools like Google Analytics or JIRA.
Conclusion
Among others Logrocket is a special tool: its killer feature lets users see the session replay and fix errors much faster. Some users say that session counting is not suitable for B2B apps: a few dozen users produce thousands of sessions due to the way they count them (30 min inactivity).
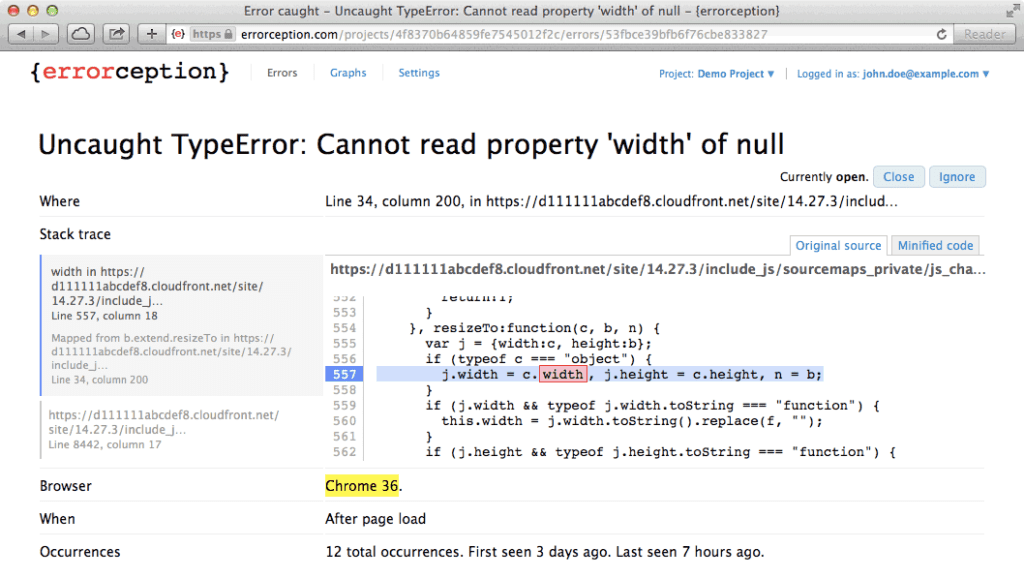
Errorception
Overview
This is the oldest and the simplest tool on the market. It was built and maintained by only one person – Rakesh Pai. It is one of the most reliable and fast tools.
Main features/killer features
Smart grouping
Errorception groups your errors together, so you don’t see a long, daunting list of logs. You see sensible, actionable errors. You don’t have to mark errors and duplicate them.
No changes to your code
Errorception is drop-in. Neither do you need to change your code, nor does Errorception modify your code or runtime. Just add a script tag, and you’re done.
Tons of integrations
With a growing list of third-party integrations, as well as with the ability to get notified with WebHooks, you get your errors where you like.
Automatically ignore errors
You probably don’t care if the Facebook Like button error’d out, or Google Analytics broke. This tool understands and hides these for you.
Additional features
Deferred async loading
Not only is Errorception’s code loaded asynchronously, it is loaded after the window’s onload has fired. And all that while still recording errors from the very beginning! Your page load time isn’t affected.
Minimal requests
Errors are buffered up in the browser for some time before they are sent to the server, to avoid unnecessary network requests. Your user’s bandwidth is a precious resource.
Minimized processing
Errorception processes errors on the server whenever possible, so that the browser spends its time running your app, not processing your errors.
Global CDN
Errorception uses Cloudflare’s powerful global network to serve the tracking JavaScript code to your users from the closest of 24 data centers around the world, for minimum latency.
Supported technologies
The product catches errors only from apps based on Javascript.
Pricing options
The pricing has 5 tiers and depends on a number of errors per day:
- Free;
- Micro – $5 per month;
- Small – $14 per month;
- Medium – $29 per month;
- Large – $59 per month.
Onboarding, installation process and dashboard
The onboarding process is similar to other tools. Just copy and paste the snippet. The dashboard is very simple, no filtration or rules to organize errors.
Documentation
Docs is very simple, but actually helps to use the tool.
Integrations
The tool doesn’t have integration out of the box, but it has an API and supports webhooks, letting you create your own integration with other services, especially notifications apps.
Conclusion
Errorception is a very fast and reliable tool. It was built with the philosophy of a high performance tool. It supports only JS apps, though, and has limited integrations and dashboard.
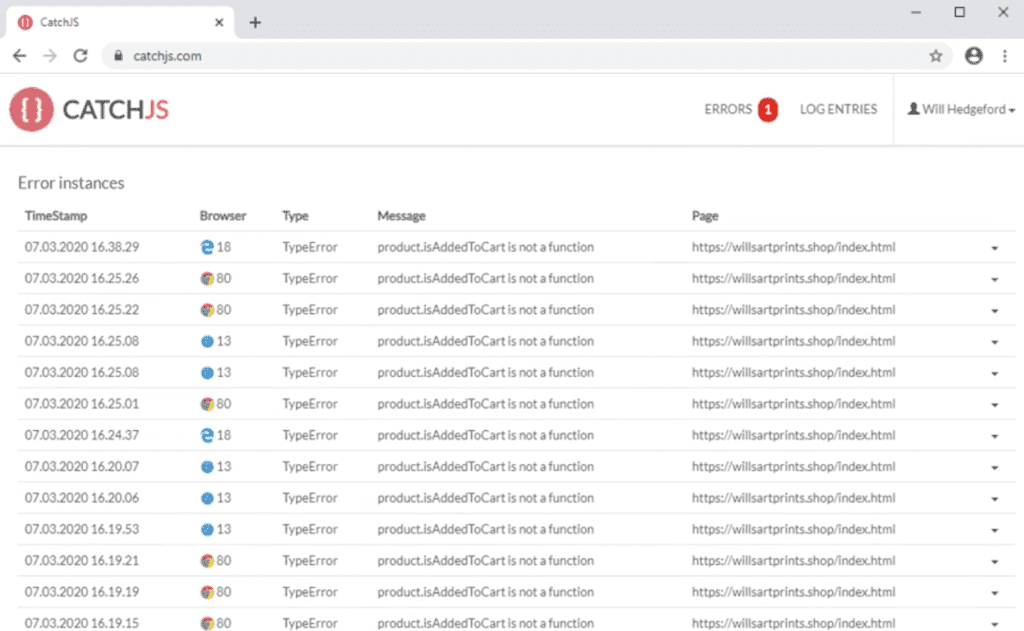
Catchjs
Overview
CatchJS is a javascript error tracker, very similar to TrackJS and Errorception. It is a lightweight and very fast working tool.
Main features/killer features
- Source Maps;
- Screenshots;
- Email Notifications;
- Stacktraces.
Additional features
- GDPR supported;
- Browsers stats;
- Error trends.
Supported technologies
Mainly Javascript technologies: React, Angular, Backbone.js
Pricing options
There are 3 tiers. The price depends on the number of logged errors.
- Development tier costs $49/month;
- Production tier costs $89/month;
- The enterprise tier costs $499/month.
Onboarding, installation process and dashboard
Just copy and paste the snippet into your app. The dashboard (and all of the application) shows minimum info.
Documentation
The documentation is very limited and has only two blocks: how to install the tool and how it works.
Integrations
No integrations out of the box. Also there is no API reference.
Conclusion
This tool is quite limited, but the cost is unfairly high compared to other instruments.
Some Alternative Tools That Can Be Used in Catching, Monitoring, and Tracking Errors
Fullstory
Fullstory is a platform that records user sessions and provides user behavior analytics on the web app, website or mobile application. The tool can be integrated with Sentry or other error monitoring tools for better bugs triaging.
New Relic
New Relic is application monitoring software that focuses on monitoring performance issues. There is, however, error monitoring functionality. It will work well in enterprise applications.
Hotjar
Hotjar is a product similar to Fullstory, but it also records user sessions. It doesn’t have built-in error monitoring tools, but you can integrate it with other instruments that help you with bug fixing.
Conclusion
We took a look at the most popular error monitoring tools on the market today. Speaking from our company – we chose Sentry for several reasons, such as open-source, reasonable pricing and comprehensive dashboard. If you work only with Javascript, though, consider looking at tools like TrackJS or Errorception. They are reliable and fast. If you have any other instruments in mind that we forgot to mention – please let us know!
Bonus
As I promised, here’s the story of the tool we’ve been developing with my partner for almost 3 years. The tool was called Kuoll. By that time there already were prominent players in the web app error monitoring market, such as Sentry, Bugsnag and NewRelic.
Why did we decide to get involved in this struggle after all? We analyzed the market, talked to the developers and found out a serious weakness in all of these tools. At that time, they have not solved the problem of finding the essence of the error. They were great at capturing the details of the error, but to find out exactly what happened, you still had to communicate with the users.
At the same time, services such as Hotjar, Yandex Webvisor, Fullstory were already on the market. These services recorded user sessions in order to analyze their behavior in a web application or website. Our respondents told us that they even tried to integrate Fullstory and Sentry together, but it didn’t work well.
We then decided that it is worth recording user sessions before an error occurs so that the developer can understand what happened without communicating with the user and without reproducing the error. This way we kept everyone’s nerves intact and saved time and money (ha ha – yes).
We were complete laymen when considering marketing and sales, but we had an understanding that the product had to be sold from the bottom up, from the developer to the top management. Thus, we began to write to web developers with a request to test the product for free and give us feedback, at the same time hoping that they would like it. They, of course, didn’t like it, but we got a lot of feedback on how to improve it. The most important result was pinpointing several key things had to be done:
- Coherent onboarding;
- Dashboard for error analysis;
- User notifications;
- Decision to record only 3 minutes before the error occurred to not load the memory.
When we did all of these, we started building a proper business. We went to two start-up accelerators and raised more than $150,000 in investments. We’ve got the first paying customers and a lot of feedback. We also made a pivot as a result of feedback from our customers and, at the end of our company, focused our efforts on servicing online stores. The idea was to show errors that critically affect in-store conversions. In the end, we had to close our startup despite everything.
Why didn’t we succeed if we had a really new and innovative idea? We have identified several reasons:
- We have not perfected one killer feature that would beat competitors. This feature was a video recording before the error occurred. The video worked very poorly and was impossible to use;
- Cold sales were a mistake as well. You don’t even need them with such a product. It was necessary to develop a site and do content marketing;
- We also had to try to focus on the product and the customer instead of raising investments;
- One last thing: in our opinion, the product should have been open-source.