Participate in our anonymous Starting Web App Research 2026 & Get 10 CreditsπŸ”₯ It only takes 3 minutes!πŸš€

Build analytics dashboard software with AI

Generate KPI cards, chart views, filters, alerts, exports, and deployment-ready code in one builder.

Preparing the analytics dashboard builder...

KPI cards and chart views CSV and API data ingestion Filters, exports, and alerts Permissions and secure sharing

Prompt example

Build an analytics dashboard for a B2B SaaS team with KPI cards, revenue and retention charts, date filters, role-based access, CSV import, scheduled email reports, and a client-facing share view.

Start inside the Flatlogic AI Web App Generator, shape the first dashboard around your metrics, then keep extending the codebase with your own team or ours.

1 app for dashboards, exports, permissions, and alert workflows
1 VM dedicated to your project instead of a locked hosted report builder
Real code so your team can keep shaping the dashboard after launch

Analytics dashboard projects usually stall on schema design, authentication, permissions, APIs, and deployment. Flatlogic starts with that foundation so your team can spend time on metrics, chart logic, and reporting workflows instead of scaffolding.

What the app should do

Build the parts that make analytics dashboard software useful in practice

Teams rarely need charts alone. They need clean data intake, filters, exports, alerts, and secure sharing around the dashboard so people can act on the numbers.

Data sources analytics dashboard preview

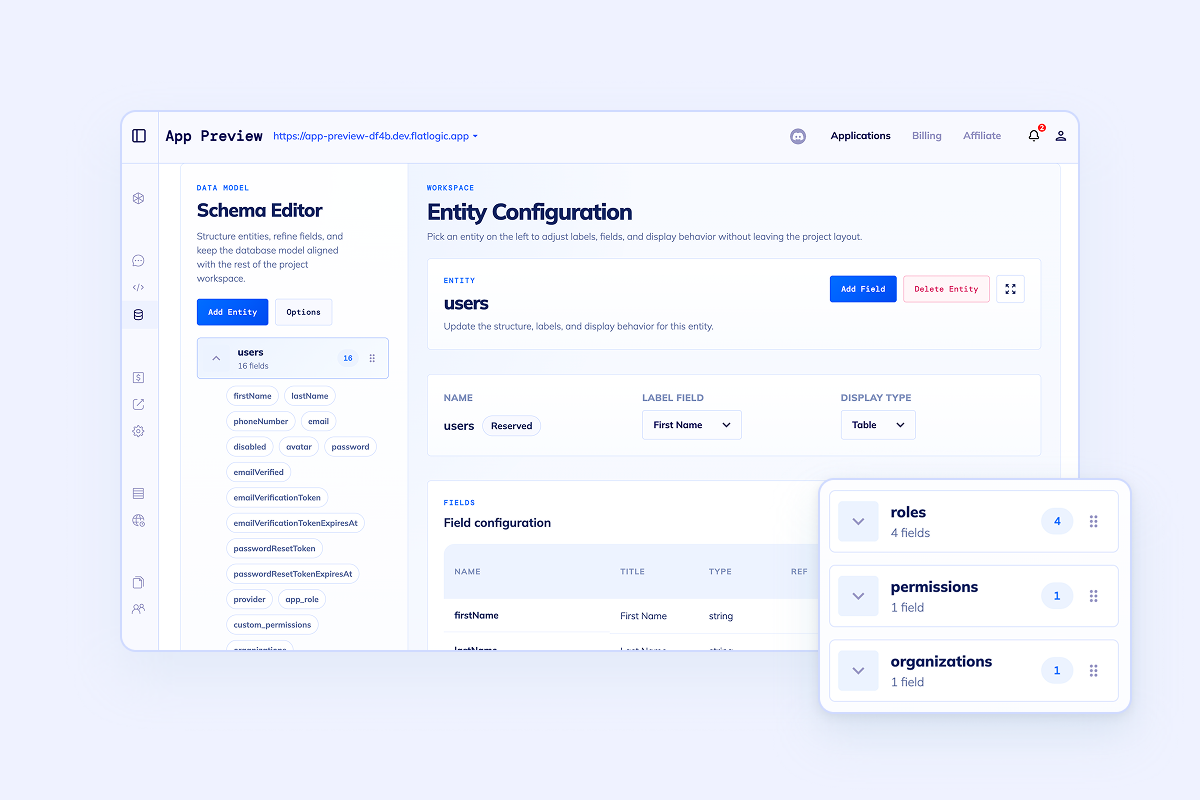
Pull data in without turning the project into an ETL side quest

Start with CSV uploads, REST APIs, scheduled refresh jobs, and the underlying schema in one codebase. Your team gets the dashboard and the data plumbing together instead of stitching them together later.

  • CSV imports for finance, ops, and spreadsheet-heavy teams
  • REST API endpoints for product, billing, and warehouse systems
  • Clear tables, relationships, and background jobs from day one
KPI boards analytics dashboard preview

Launch dashboard views that actually help teams make decisions

Generate executive overviews, team-specific boards, drill-down reports, and date-range filters. Keep metrics, charts, and tables together so users can move from signal to action quickly.

  • Revenue, retention, and usage views for leadership
  • Operational queues, anomalies, and threshold monitors for teams
  • Saved filters and report layouts for repeat workflows
Alerts analytics dashboard preview

Turn the dashboard into a system that nudges people when numbers move

Add change thresholds, scheduled summaries, notifications, and audit trails. The result is not just a dashboard that looks good on Monday morning, but a workflow surface teams can rely on every day.

  • Email and in-app notifications for spikes, drops, and misses
  • Audit history for key metric changes and rule updates
  • Realtime widgets where fast-moving numbers matter
Secure sharing analytics dashboard preview

Give each team, customer, or executive the right dashboard view

Set up authentication, role-based access, and client-facing share surfaces in the same app. That makes it easier to support internal analytics and external reporting without creating two separate products.

  • Different views for operators, managers, and leadership
  • Customer-facing analytics workspaces when needed
  • Shareable exports and secure login paths in one system

Chart examples

Put real dashboard data in front of the buyer, not generic placeholders

A strong analytics dashboard builder should support executive metrics, operational watchlists, and shared KPI views. This page shows that shape directly.

Executive overview

Revenue, retention, and expansion in one view

Last 30 days
Net revenue retention 118% +6.4 pts
Pipeline coverage 3.9x +0.7x
Trial-to-paid 14.2% +1.9 pts
Growth trend weekly view
$84k W1
$89k W2
$93k W3
$101k W4
$97k W5
$108k W6
+18% MRR growth New expansion revenue pushed the last two weeks above target.

Alert center

What needs attention now

7 live
  • MRR dipped below forecast Finance summary sent 14m ago
  • Warehouse backlog above threshold Ops dashboard flagged shift handoff
  • Trial conversion trending up Growth report ready to share

Shared KPI view

One dashboard, several audiences

Secure
Leadership overview
92%
Ops command center
78%
Client share workspace
64%

Beyond the dashboard

Keep the analytics app expandable when reporting stops being the only requirement

The first version might be a dashboard builder. The second version often needs approvals, portal access, CRM workflows, or ERP-style operations around the reporting layer.

Analytics dashboard capability icon

You get a working analytics dashboard codebase with schema, auth, and frontend scaffolding already connected.

Analytics dashboard capability icon

You get the freedom to keep building with your own developers or bring in the Flatlogic team for deeper custom work.

Analytics dashboard capability icon

You get a faster path to filtered reports, exports, alerts, and production deployment than starting from a blank repo.

The dashboard can stay focused without boxing you in later

Use this page when the primary job is reporting and KPI visibility. If the project also needs back-office workflows, pair it with the AI Admin Panel Generator. If customers need their own secure reporting surface, move toward the Client Portal Builder.

When the analytics layer becomes part of sales or customer operations, the natural next step is Custom CRM. When it becomes the reporting surface for purchasing, inventory, finance, or approvals, it overlaps more with Custom ERP.

Start with the generator Keep the code, deployment path, and extension options

FAQ

Common questions before teams build analytics dashboard software

Most objections are about data sources, permissions, and long-term ownership. Answer those well and the page becomes much easier to trust.

Start with one strong dashboard

Generate the first analytics dashboard, then keep shipping from there

Describe the KPIs, charts, filters, permissions, and data sources you need. Flatlogic will stand up the first version fast so your team can iterate on the actual reporting logic instead of rebuilding the plumbing.