TL;DR
- Explains KPIs and why relevance matters; unifying key metrics on one dashboard is the main challenge.
- Outlines essential visuals: numbers, line/bar/stacked, progress, pie/donut, gauge, pictograms, PBC, combo; plus filters and reports.
- Presents 10 templates: Sing App, Simple KPI Retail, Light Blue, Limitless, Cork, Paper, Pick, Able Pro, Architect UI, Flatlogic One.
- Highlights features like export options, live updates, multiple layouts, and prebuilt dashboards for faster KPI tracking.
Fact Box
- Paper Admin Template includes eleven dashboards in the package. Source
- Cork Admin offers 10+ layout options and a Laravel version. Source
- Flatlogic One launched in July 2020 with 2 KPI dashboards and 4 extra chart pages. Source
- Sing App supports SVG/PNG graph export, interactive pointers, and adjustable calculation periods. Source
- Simple KPI Retail Dashboard comes preloaded with retail KPIs; customization is limited. Source
KPIs or Key Performance Indicators are a modern instrument to make a system (business, for example) work effectively. KPIs show how successful the business is, or how professional the employee is. It works with the help of measurable values, that are intended to show the success of achieving your strategic goals. KPIs are measurable indicators that you should track, calculate, analyze, and represent. If you read this article, it means that you want to find or build an app to help you in all operations above. But before we list the top dashboard KPI templates, it’s essential to understand how exactly to choose a set of indicators that boost the growth of a business. For KPIs to be useful, they should be relevant to a business. This is crucial not only for entrepreneurs who try to improve their businesses but also for the developers of the software for tracking KPIs. Why? To bridge this gap, teams often use comprehensive operational platforms like MonsterOps to capture raw field metrics and backend data, making it much easier to pipe relevant information straight into your monitoring tools.
In developing business software, developers must integrate tools that enable easy and effective use of KPIs, navigating through the plethora of guides and strategies on selecting and tracking the right performance indicators to ensure the creation of a high-quality web application.
However, from our point of view, the most challenging part of such an app is building a dashboard that displays all necessary KPIs on a single screen. We have explored the Internet, analyzed different types of tools to represent KPIs, and found great dashboards, and manmade lists: one consists of the charts and instruments you should include in your future app, and the other is the top dashboards we found that contain elements from the first top. Each KPI template on the list is a potent tool that will boost your metrics considerably. Let’s start from the first list.
Enjoy reading!
What Instruments Do We Need to Build an Effective Dashboard for KPIs?
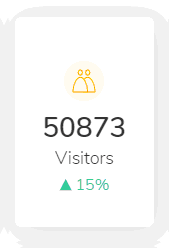
Absolute numerical values and percentages (in absolute amount)
With the help of percentages you can make it more informative by adding the comparison of KPI with the previous periods.

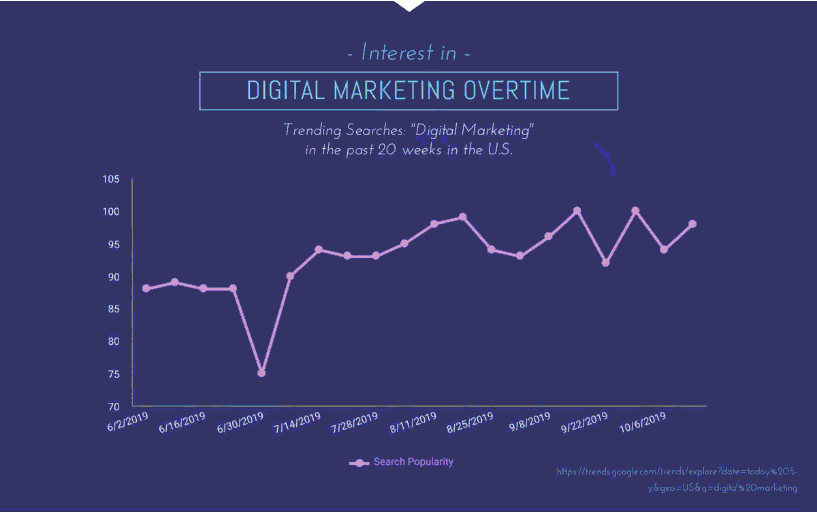
Non-linear chart
One of the core charts.
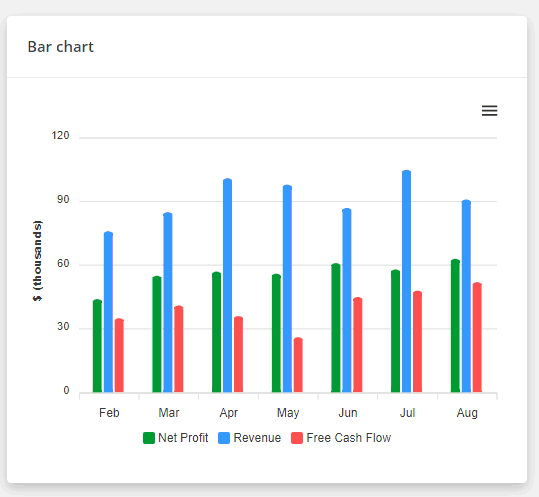
Bar chart
Another core element to display KPIs.
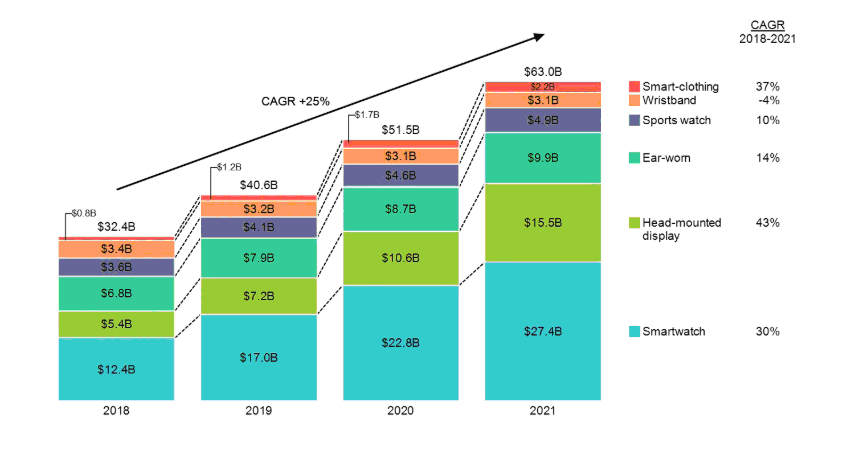
Stacked Bar Graphs
It’s a more complex instrument, but more informative respectively.
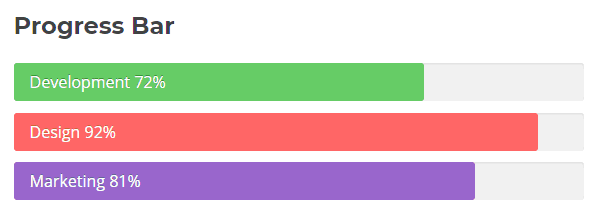
Progress bars
Can be confused with a horizontal bar chart. The main difference: a horizontal bar chart is used to compare the values in several categories, while a progress bar is supposed to show the progress in a single category.
Pie charts
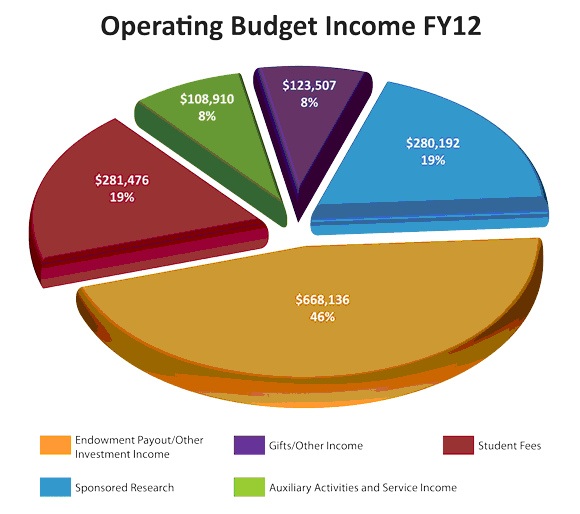
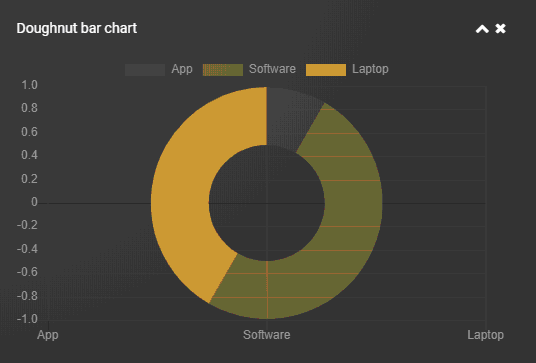
Donut chart
You can replace pie charts with a donut chart, the meaning is the same.
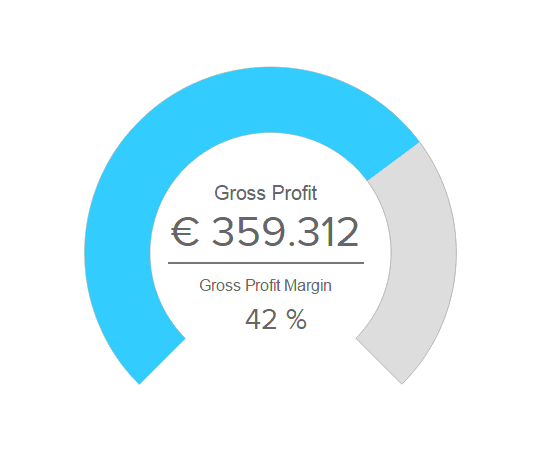
Gauge chart
This chart helps users to track their progress toward achieving goals. It’s interchangeable with a progress bar.
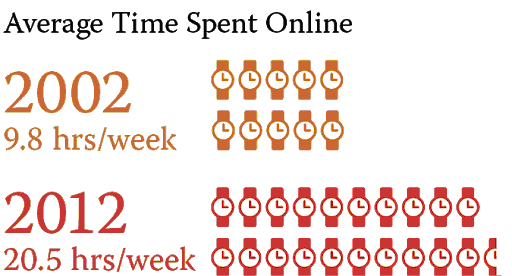
Pictograms
Instead of using an axis with numbers, it uses pictures to represent a relative or an absolute number of items.
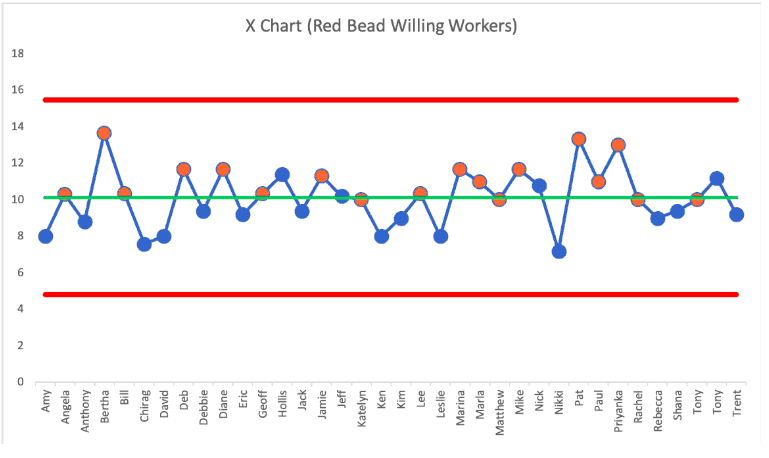
Process behavior chart
Especially valuable for financial KPIs. The mainline shows measurement over time or categories, while the two red lines are control limits that shouldn’t be surpassed.
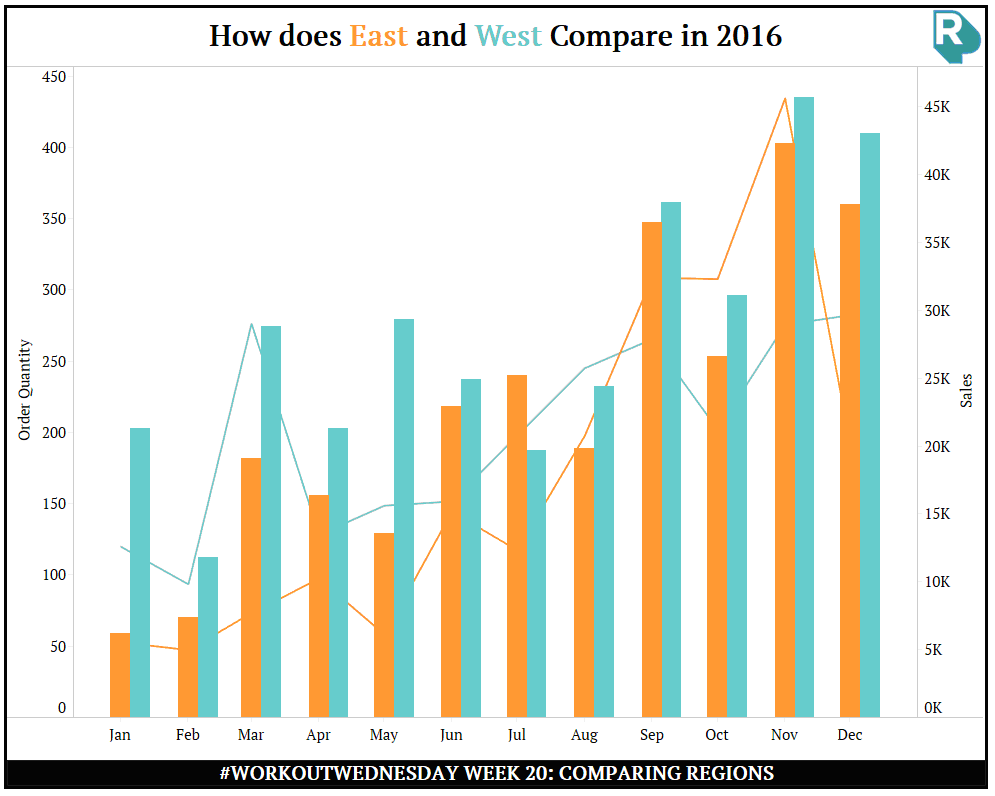
Combined bar and line graph
Some additional tools:
These tools are also essential for building a dashboard for tracking KPIs: calendar, dropdowns, checkboxes, and input fields. The option to create and download a report will also be helpful.

The Top Dashboards for Tracking KPIs
Sing App Admin Dashboard
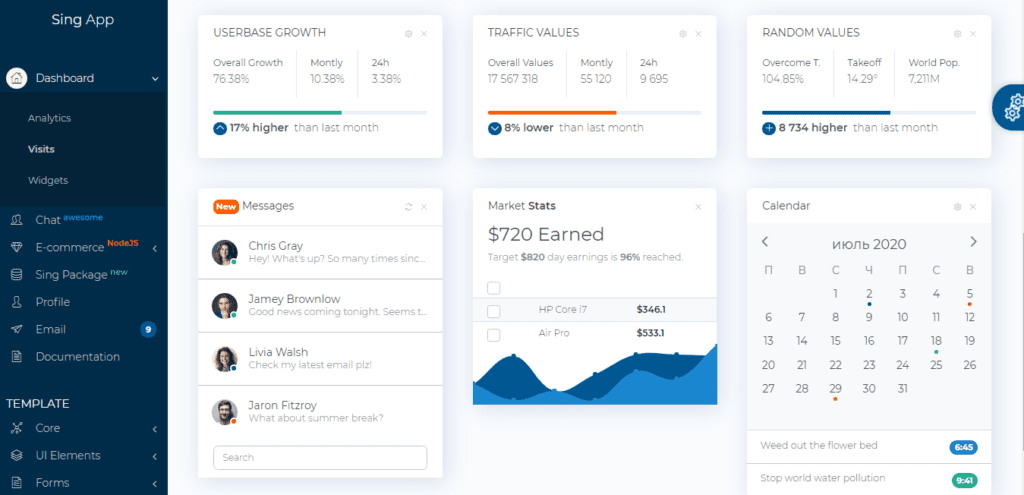
If you look through a huge number of KPI templates and don’t find one that you need, you should take a look at Sithe ng app. Sing is a premium admin dashboard template that offers all necessary opportunities to turn data into easy-to-understand graphs and charts. Besides all charts and functions listed above, with Sing, you get such options as downloading graphs in SVG and PNG format, an imated and interactive pointer that highlights the point where the cursor is placed, and changing period for values calculation inside the frame with the graph!
Retail Dashboard from Simple KPI
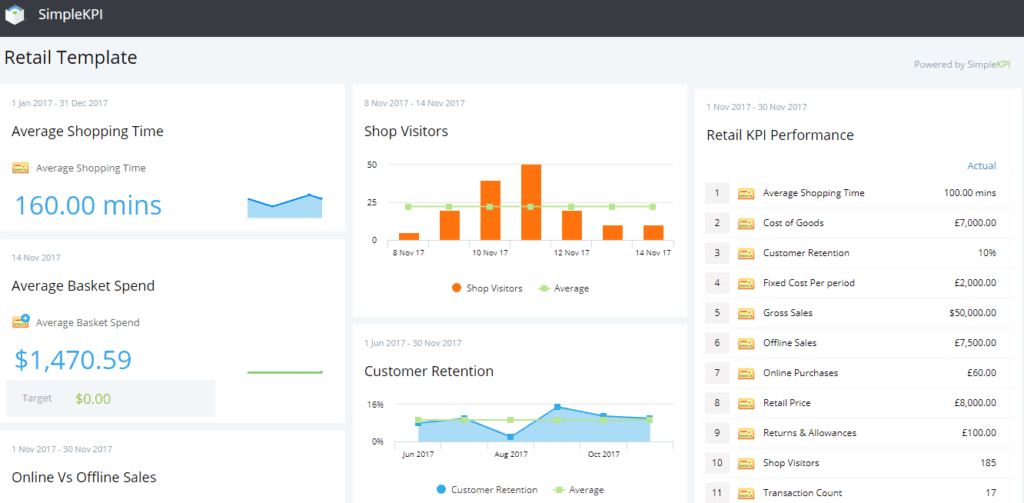
That is a dashboard focused on the retail trade sphere. It already contains relevant KPIs and Metrics for that sector, so you need just to download it and use it. Since it’s an opinioned dashboard you will not get a great customization option. If you are a retailer or trader you should try that dashboard to track the performance when selling goods or services.
Light Blue React Node.js
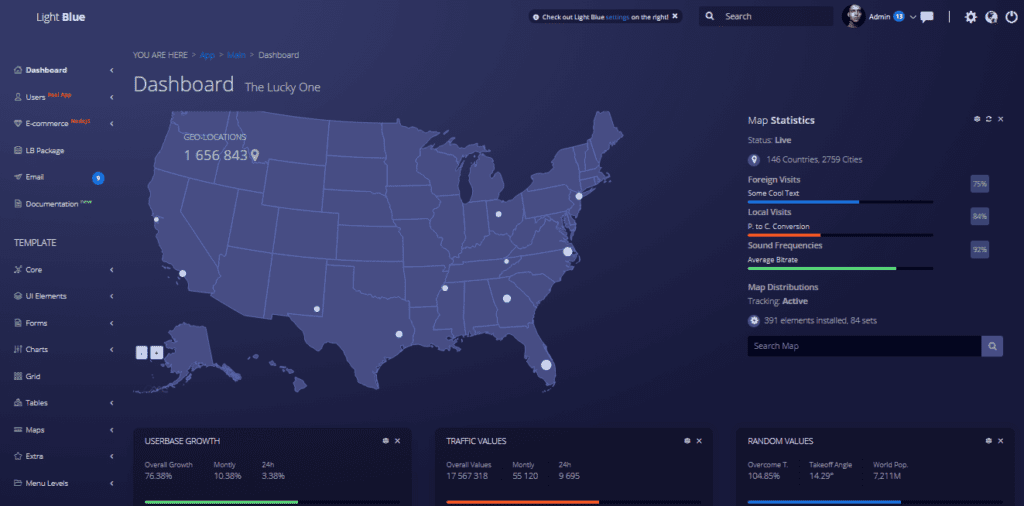
It is a React Admin dashboard template with a Node.JS backend. The template is better suited for KPIs that reflect goals in web app traffic analysis, revenue and current balance tracking, and sales management. However, Light Blue contains a lot of ready-to-use working components and charts to build a necessary dashboard. It’s very easy to customize and implement, both beginners in React and professional developers can benefit from that template and get a track onofPIs, metrics, and business data.
Limitless Dashboard
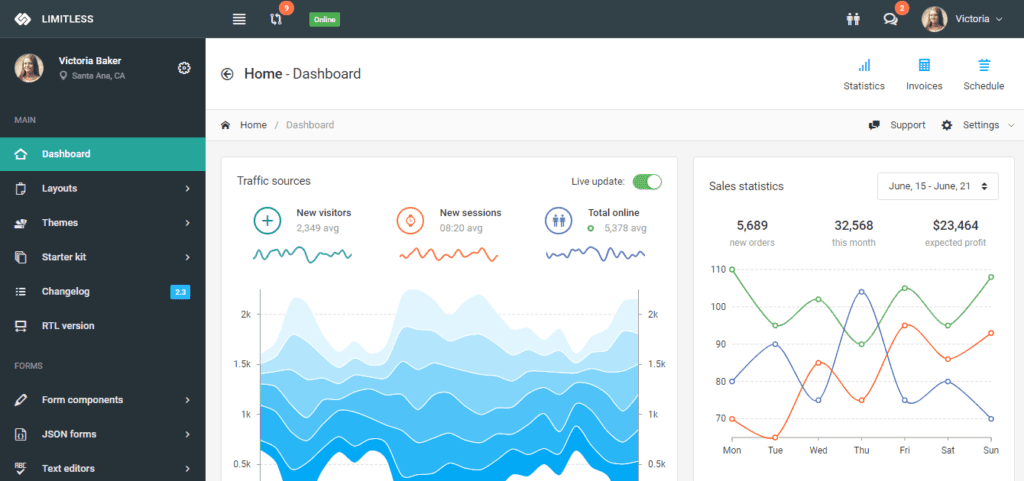
Limitless is a powerful admin template and a best-seller on ThemeForest. It goes with a modern business KPI dashboard that simplifies the processes of monitoring, analyzing, and generating insights. With the help of that dashboard, you can easily monitor the progress of growing sales or traffic and adjust the sales strategy according to customer behavior. Furthermore, the dashboard contains a live update feature to keep you abreast of the latest changes.
Cork Admin Dashboard
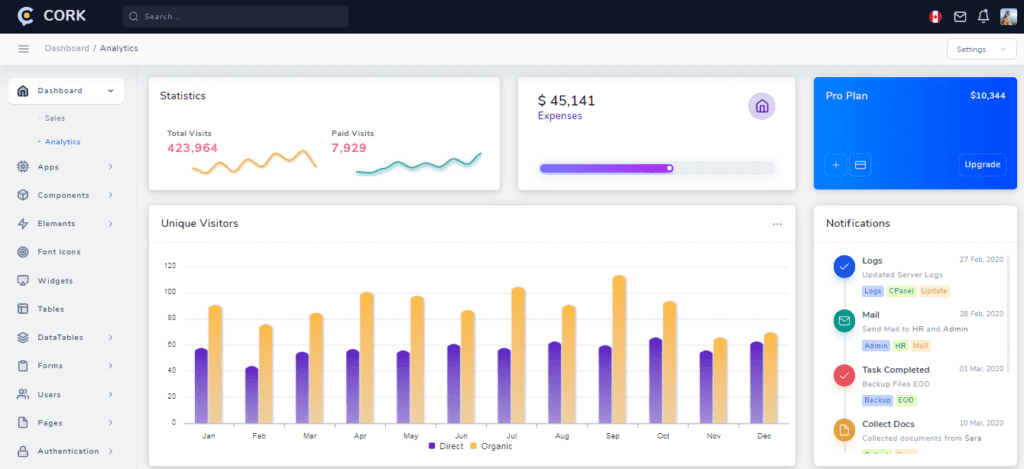
That is an awesome bootstrap-based dashboard template that follows the best design and programming principles. The template provides you with more than 10 layout options and a Laa ravel Version of the extremely rare dashboard. Several pages with charts and two dashboards with different metrics ensure you have the basic elements to build a great dashboard for tracking KPIs.
Paper Admin Template
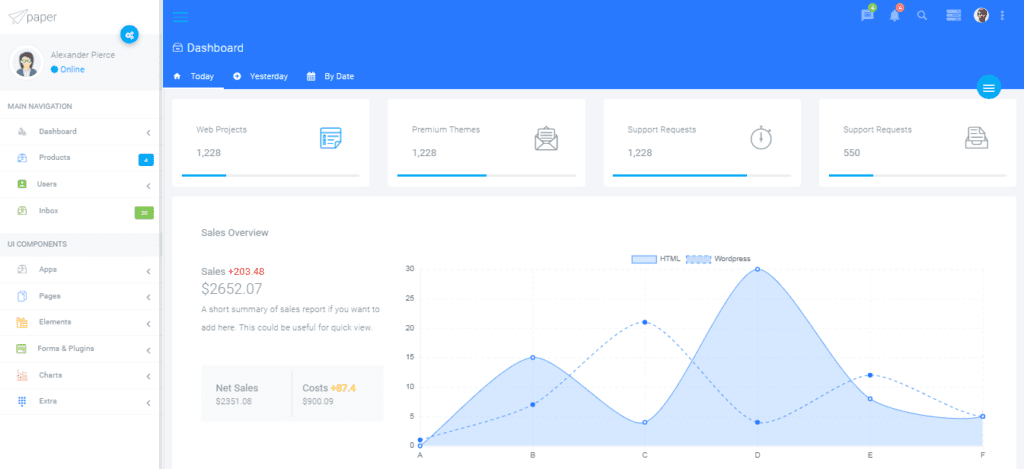
This template fits you if you are looking for a concrete solution since Paper goes with eleven dashboards in the package! They all are unnamed so it will take time to look through them, but that time will be less than time for building your dashboard. Every dashboard provides a simple single-screen view of data and allows sharing it with your colleagues.
Pick Admin Dashboard Template
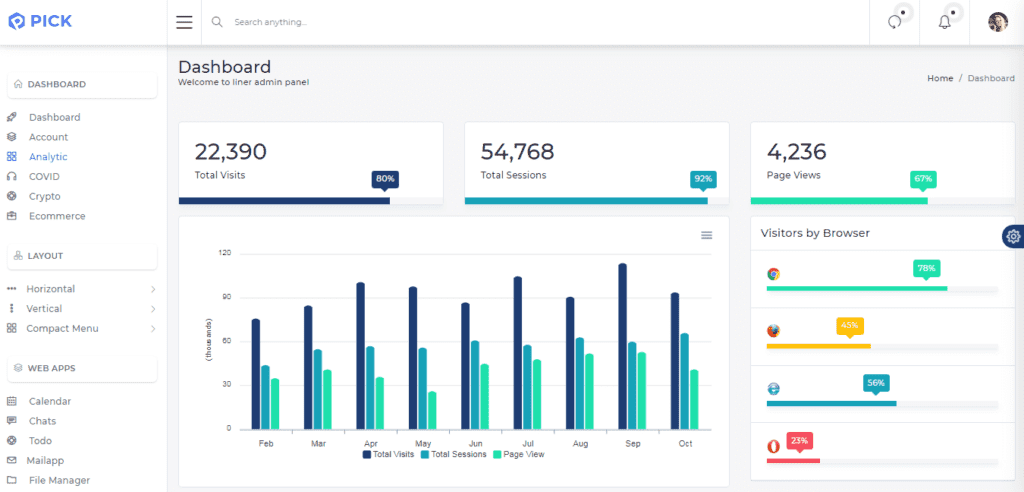
Pick is a modern and stylish solution for the IT industry. It’s a multipurpose dashboard that helps you gain full control over your performance.
Able Pro Admin Dashboard
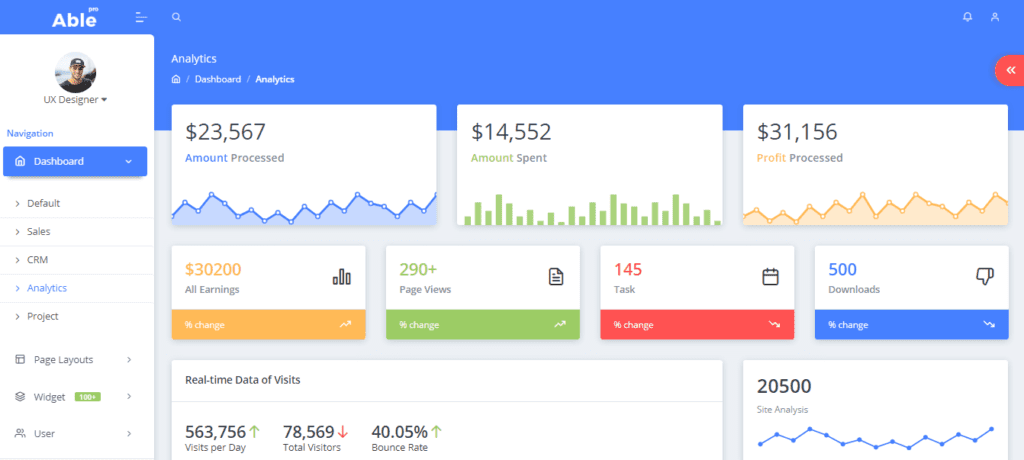
If you believe that the most qualified products are the most rated products, take a look at Able Pro. Able Pro is the best-rated bootstrap admin template on Themeforest. The human eye captures information within the graph blazingly fast! With this dashboard, you can go much deeper into the understanding of KPIs and make the decision-making process much easier.
Architect UI Admin Template
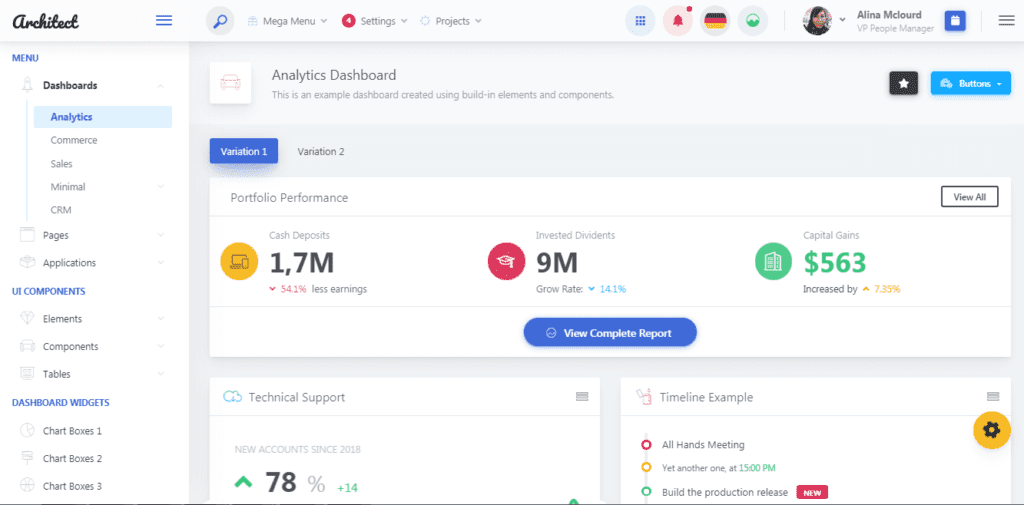
Those who download Architect UI make the right choice. This KPI template was created with hundreds of built-in elements and components, and three blocks of charts. The modular frontend architecture makes dashboard customization fast and easy, while animated graphs provide insights about KPIs.

Flatlogic One Admin Dashboard Template
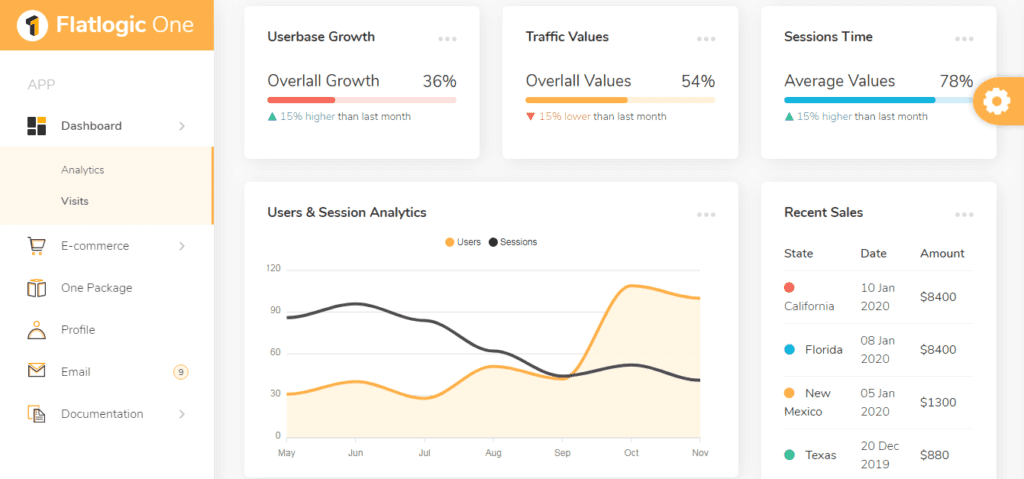
Flatlogic is a one-size-fits-all solution for any type of dashboard. It is a premium bootstrap admin dashboard template that was released recently in July 2020. It goes with two developed dashboards that serve well as KPI templates: analytics and visits. But it also offers four additional pages with smoothly animated charts for any taste and needs. The dashboard is flexible and highly customizable, so you easily get the benefit from that template.
Thanks for reading.