TL;DR
- Run-time log collection and filtering adds real-time monitoring and diagnostics to Flatlogic apps.
- Instant access to info, warning, and error logs improves visibility and control.
- Custom filters by date and log type enable targeted analysis and faster issue resolution.
- Log aggregation and focused views streamline troubleshooting and raise team productivity.
Fact Box
- Flatlogic application now features run-time log collection and filtering.
- Users can view informational, warning, and error logs to monitor app performance.
- Filters include date and log type to target analysis of application activity.
- Log aggregation and filters make troubleshooting faster and more efficient.
- Flatlogic invites support questions via its forum. Source
Our application now features a run-time log collection and filtering capability, providing users with a highly effective tool for monitoring and diagnosing their applications in real-time.
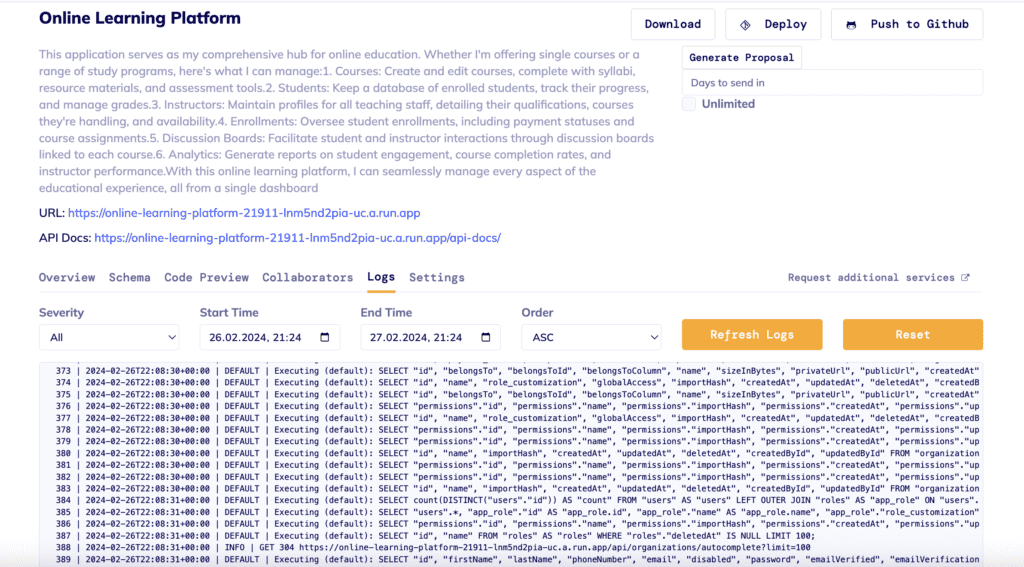
This functionality offers deep insights into application performance and makes the troubleshooting process quick and easy. Here are some key features and benefits offered by this new feature:
- Instant Access to Critical Information: Users can now easily view various types of logs, from informational messages to warnings and errors, giving them complete control and transparency over the performance of their applications.
- Customizable Filters for Efficient Analysis: With customizable filters such as date and log type, users can more targetedly analyze their application’s activity, allowing for quick identification and resolution of potential issues.
- Enhanced Troubleshooting: Carefully designed filters and log aggregation capabilities make the process of troubleshooting applications much more efficient. Instead of sifting through vast amounts of data, users can focus on the specific logs that are most relevant to their current tasks.
- Increased Efficiency and Performance: Having access to the right information at the right time enables development teams to make informed decisions faster, increasing overall efficiency and productivity in managing applications.
Summing Up
With the latest updates, the Flatlogic platform offers an even stronger set of tools to improve your app’s performance and user experience, keeping things simple and flexible for business software development. If you face any difficulties setting up this or that template or admin dashboard, please feel free to message us on our forum, Twitter, or Facebook. We will respond to your inquiry as quickly as possible!