JavaScript Charting Libraries: Introduction
Nowadays people are struggling more and more with the problem of scattered attention. It becomes a necessity to collect, summarize and present any info in a well-structured, interesting way, especially if you have a complex business application. Presenting huge chunks of data in a standard spreadsheet to analyze or to study is as inconvenient as it can get. Creating different charts and JavaScript charting in particular is a big issue that we will consider. Addressing scattered attention in the modern digital landscape is imperative for business software, where the ability to condense and display complex data through JavaScript charting becomes a vital tool for enhancing user engagement and facilitating more intuitive data analysis.
JavaScript charts are an essential part of a web application for presenting data. It means JavaScript charting libraries are inevitable. The way the human brain itself is programmed is that it understands visual data much better than anything else. Well, visualized data creates much more influence than the data being presented as it is, no matter how well it is explained.
Companies build strategies around the charts, numbers, and tables they’re presented with, and often use them to choose whether to pursue business opportunities. It is very important to choose the right tool to build a workaround.
But how do you choose a tool that will fit your requirements in the javascript technology zoo? How do you choose the right graphics for your data? Should it be paid or free? Build your solution or take a ready-made tool?
We will try to cover all these questions in this guide. First, we will talk about how to choose the right JavaScript charting library. Then we will define the criteria for evaluating the tools, and finally, compare the most popular JavaScript charts on the market.
How to choose the right JavaScript charting library?
When you approach the choice of the JS chart library, everything is highly individual and depends on many criteria. Therefore, in this section, we will consider things you should pay attention to while choosing the tools for drawing charts.

Selecting the right JS chart library for your business software involves more than just aesthetics, it requires a deep dive into the library’s adaptability to your specific business needs, the complexity of data it can handle, and its reliability as a foundation for your data visualization strategies.
There are several factors to consider here:
- What kind of charts does the company want to build? Pie charts, maps, lines, bars?
- How large is the dataset?
- Is the app going to be used for Web, mobile, or both?
- SVG or Canvas base? Libraries based on SVG are usually better for smaller to medium datasets, as each element is a unique node and exists in the DOM tree. On the other hand, Canvas is fast.
- What is the browser support for a given library? Check your browser market share to figure this out.
- Which JavaScript framework do you use?
- What kind of customization of the look and feel do you need?
Note that in some cases you may not need a data visualization library at all. Sometimes it’s better just to write one from scratch using vanilla JavaScript.
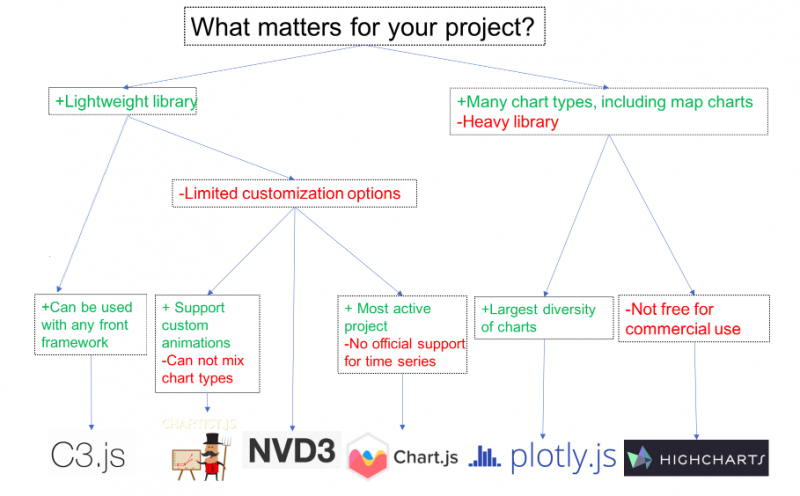
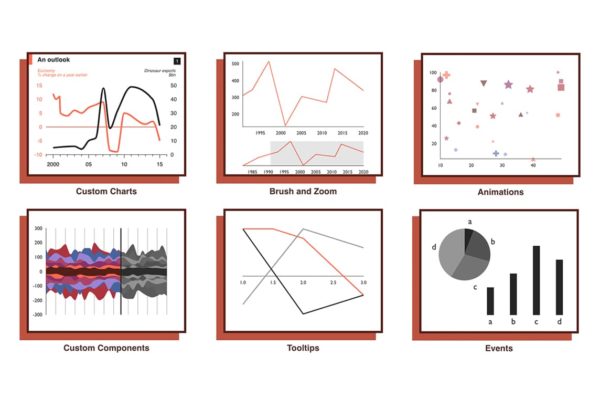
Here is an example of a decision diagram that I have found on the internet.
Top JavaScript Charting Libraries
| Name | License | Price Range | Main Dependencies | Notable Features and Information | Website |
|---|---|---|---|---|---|
| Highcharts | Free for non-commercial, paid for commercial | Free to $7060 | None | SVG-based, responsive, compatible with big data | highcharts.com |
| Chartist-js | Open-source | Free | None | SVG animations, easy implementation, customizable | gionkunz.github.io/chartist-js |
| C3.js | Open-source | Free | D3.js | Fast rendering, browser compatibility, simple integration | c3js.org |
| Chart.js | Open-source | Free | Moment.js | HTML5-based, animated, interactive charts, canvas use | chartjs.org |
| Plotly | Open-source, paid-for enterprise | Free, paid-for enterprise | D3.js, Stack. Gl | Rich library, 20 chart types, professional look | plot.ly |
| NVD3 | Open-source, paid-for enterprise | Free, paid-for enterprise | D3.js | Basic animations, .json data integration | nvd3.org |
| Fusion Charts | Paid | From $497 | None | Extensive chart and map types, cross-device compatibility | fusioncharts.com |
| DyGraphs | Open-source | Free for all users | None | Suited for large data sets, customizable | dygraphs.com |
| D3.js | Open-source | Free for all users | None | Extensive charting methods support all modern browsers | d3js.org |
| Sigma charts | Open-source | Free for all users | None | Built on Canvas and WebGL, interactive | sigmajs.org |
| Morris charts | Open-source | Free for all users | jQuery | Simple, effective charts, used in admin templates | morrisjs.github.io/morris.js |
| Cytoscape | Open-source | Free for all users | None | Graph theory library, interactive graphs | js.cytoscape.org |
| Rickshaw | Open-source | Free for all users | D3.js, jQuery, jsdom | Interactive time-series graphs, SVG and CSS-based | tech.shutterstock.com/rickshaw |
| CanvasJS charts | Paid, free for students, and non-commercial | $149 to $4999 | None | HTML5 charting library, high performance, simple API | canvasjs.com |
| Koolchart | Paid | $350 to $1280 | None | Canvas-based, clean visuals, performance-oriented | koolchart.com |
| Rawgraphs | Apache 2.0 | Free | d3.js | Custom vector-based visualizations, SVG format | rawgraphs.io |
| Taucharts | Apache 2.0 | Free | d3.js | Flexible, data-focused, extensive API access | taucharts.com |
| Anychart | Paid for commercial use, free for non-commercial | $49 to $799 to custom price | None | SVG/VML renderings support a variety of data sets | anychart.com |
| Recharts | MIT | Free | d3.js | Modular components, extensive documentation | recharts.org/en-US |
In this article, each JavaScript charting library will be compared with some key factors including chart types, commercial or free, and open-source status. These beautiful libraries have been analyzed thoroughly with hands-on experience to maximize the very best comparison.
1. Highcharts
License: Free for non-commercial, paid for commercial
Price: Free to $7060
Main dependencies: No dependencies
Website: https://www.highcharts.com/
HighCharts is a modern JavaScript charting library based on SVG technology. It doesn’t require any plugins. The integration with all of the major web frameworks is very simple.
In all of its simplicity, Highcharts is also very much compatible with old browsers, so you can pick it if you don’t need to represent data using advanced charting styles.
Notable Features:
- Optimized for both responsive design and touch devices;
- Capable of working with Big Data;
- On-hover tooltips rendering is super-quick;
- Ability to annotate graphs;
- Data can be loaded directly to charts from a CSV file.
Highcharts allows you to configure the theme separately from the data. This allows you to have a common theme for your brand to apply across all the charts on your website.
Highcharts is extensively documented and has most use cases covered.
HighCharts is used by several major companies across the world, including Facebook, IBM, MasterCard, and StackOverflow. It’s probably the most advanced library out there regarding the types of charts available, but of course, it comes at a cost for commercial use. If pricing is not a stumble, Highcharts is an excellent choice.
2. Chartist-js
License: Open-source
Price: Free
Main dependencies: No dependencies
Web-site: http://gionkunz.github.io/chartist-js/
Chartist is a very modern, SVG-based library. Its biggest feature is the SVG animations in the charts produced with this library.
It has a solid technology base and is very easy to implement. Within minutes you can make an incredibly impressive chart that interacts easily with any backend data source. Chartist is really easy to configure, as well as easy to customize with Sass.
This library has only 8 base chart types which can be used to improvise over a few more different types. Each is fully responsive but doesn’t have a great transitional effect as the others.
Features:
- Filtering by labels; Click on a legend to show and hide data on the chart;
- Non-numeric Y-Axis, have labels instead;
- Easy customization with interpolation of line charts.
The Chart.js visualization library is completely open-sourced with the MIT License and is available to modify, distribute, and use. Source files are also available to ‘fork’ on GitHub.
Chart.js offers a vast documentation base, including precise instructions on installing the library. The library can be quickly installed with Bower, NPM, and jsDelivr, and can even be linked up from CDNJS. Besides, you can download the source files directly from GitHub Repo.
Chartist is a very powerful charting library, but it requires more work on the developer’s end to get things to look right.
3. C3.js
License: Open-source
Price: Free
Main dependencies: D3.js
Website: https://c3js.org/
C3 is a very efficient D3-based chart visualization library. C3 library is fast to render, has good compatibility across browsers, and is very simple to integrate. If you’re looking for no-frills, C3 is a decent choice.
It also includes good documentation for what is an inherently simple library.
Features:
- Extensive tutorials and documentation;
- Responsive and mobile-ready;
- Stylish tooltips already integrated;
- Filterable data series.
C3 provides a getting started guide that instructs on how to get the basic library setup with your project.
4. Chart.js
License: Open-source
Price: Free
Main dependencies: Moment.js
Website: https://www.chartjs.org/

Chart js is an HTML5-based JavaScript library for creating animated, interactive, and customizable charts and graphs. Chart.js is a much lighter product than HighCharts and doesn’t offer quite as much choice.
The Chart.js API is fairly simple and well-documented. Chart.js uses Canvas instead of SVG. The library is actively maintained and has a few plugins to extend its functionality.
Chart.js offers 8 different chart types for data visualization with out-of-the-box animations. It is compatible with all modern browsers. Also, the responsive chart behavior of the charts can be enabled by some configurations.
5. Plotly
License: Open-source
Price: Free, paid for enterprise
Main dependencies: D3.js, Stack.gl
Website: https://plot.ly/
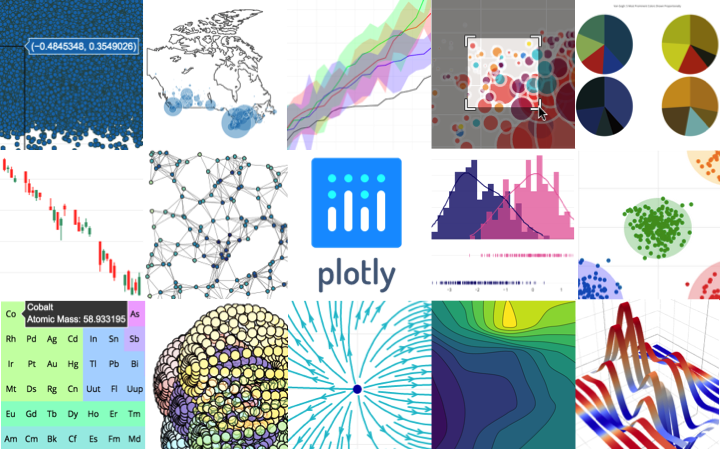
Plotly is one of the most commonly used libraries in web development. Plotly is a very rich library and has outstanding documentation, including a tutorial for each of the chart types.
It has been open-source since 2015, meaning anyone can use it for free. Plotly supports 20 chart types, including SVG maps, 3D charts, and statistical graphs. It’s built on top of D3.js and stack.gl.
The charts and graph types available have a professional look and feel. Creating a chart is just a matter of loading your information and customizing the layout, axes, notes, and legend.
6. NVD3
License: Open-source
Price: Free, paid for enterprise
Main dependencies: D3.js
Website: http://nvd3.org/
NVD3 is also on the list of the most popular libraries. Built upon D3.js like the others above, it does have a solid technical base.
The performance is relatively good, and it does have basic animations to inject some visual stimulation in an otherwise fairly plain interface. Data can be pumped directly from .json files, meaning NVD3 is very easy to integrate with existing data API solutions.
When compared to other libraries on this list, it looks rather small with many charts not available, but most of the general graph types are present.
This visualization library is completely open-sourced with the Apache 2.0 License.
7. Fusion Charts
License: Paid
Price: From $497
Main dependencies: No dependencies
Website: https://www.fusioncharts.com/
FusionCharts probably has the most complete collection of charts and maps. With over 90+ chart types and 965 maps, you’ll find everything that you need right out of the box.
FusionCharts supports both JSON and XML data formats, and you can export charts in PNG, JPEG, SVG, or PDF. They have a nice collection of business dashboards and live demos for inspiration.
Their charts and maps work across all devices and platforms, are highly customizable, and have beautiful interactions. But with all of that, FusionCharts is rather pricey.
8. DyGraphs
License: Open-source
Price: Free for all users
Main dependencies: –
Website: http://dygraphs.com/

DyGraphs is a fast, flexible open-source JavaScript charting library. It is highly customizable, works in all major browsers (including IE8), and has an active community.
Features:
- Linear regression;
- Synchronization across multiple graphs;
- Zoom capability;
- Highlighted regions.
DyGraphs is well suited for large and complex data sets.
9. D3.js
License: Open-source
Price: Free for all users
Main dependencies: –
Website: https://d3js.org/
D3 is an open-source JavaScript library released under the BSD license. It provides a tremendous amount of charts, graphs, and other methods for data visualization. D3 gives you almost everything you need to visually represent your data of any kind.
The website provides comprehensive documentation. There are examples provided to help with getting started and using the library.
D3 supports all modern browsers. It has been tested on browsers including Firefox, Google Chrome, Safari, Opera, IE9+, Android, and iOS.
There are two major concerns with D3.js: it has a steep learning curve and it is compatible only with modern browsers (IE 9+). Pick it up only if you have enough time to learn and adopt it.
10. Sigma charts
License: Open-source
Price: Free for all users
Main dependencies: No dependencies
Website: http://sigmajs.org
Sigma.js is built on Canvas and WebGL and has a public API, embracing a wide range of plugins contributed by the GitHub community. Sigma is fully responsive and touch-interactive. It allows developers to directly add their functions to the scripts and render nodes and edges exactly to spec.
Sigma provides a lot of different settings to make it easy to customize drawings and interaction with networks. Sigma is a rendering engine, and it’s up to you to add all the interactivity you want. The public API makes it possible to modify the data, move the camera, refresh the rendering, listen to events, etc.
It suits best for developers who need a powerful, dedicated graph drawing tool.
11. Morris charts
License: Open-source
Price: Free for all users
Main dependencies: jQuery
Website: http://morrisjs.github.io/morris.js/
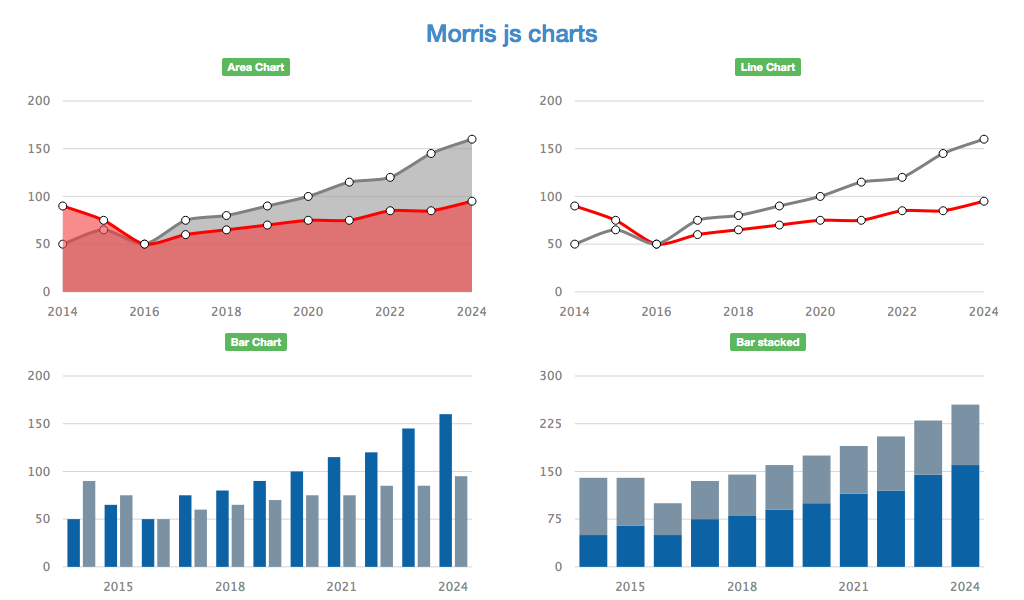
Morris.js charting library is quite popular as well. It is used in many admin templates – both free and premium. The charts used in Morris focus on simplicity and effectiveness.
There are 4 types of charts in the library – line, area, bar, and donut charts.
Morris charts provide a free license. License details are provided on the website. There is also detailed documentation for the charts.
12. Cytoscape
License: Open-source
Price: Free for all users
Main dependencies: No dependencies
Website: http://js.cytoscape.org/
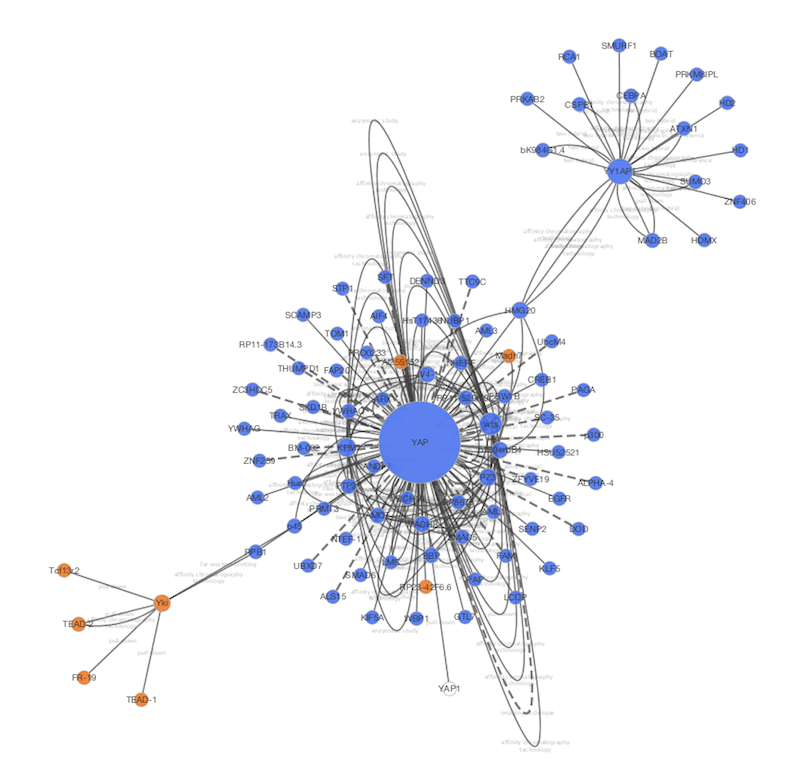
Cytoscape.js is an open-source graph theory library written in JS. You can use Cytoscape.js for graph analysis and visualization.
Cytoscape.js allows you to easily display and manipulate rich, interactive graphs. Cytoscape.js includes all the gestures out-of-the-box, including pinch-to-zoom, box selection, panning, et cetera.
Cytoscape.js also has graph analysis. The library contains many useful functions in graph theory. You can use Cytoscape.js headlessly on Node.js to do graph analysis in the terminal or on a web server.
13. Rickshaw by Shutterstock
License: Open-source
Price: Free for all users
Main dependencies: D3.js, jQuery, jsdom
Website: https://tech.shutterstock.com/rickshaw/
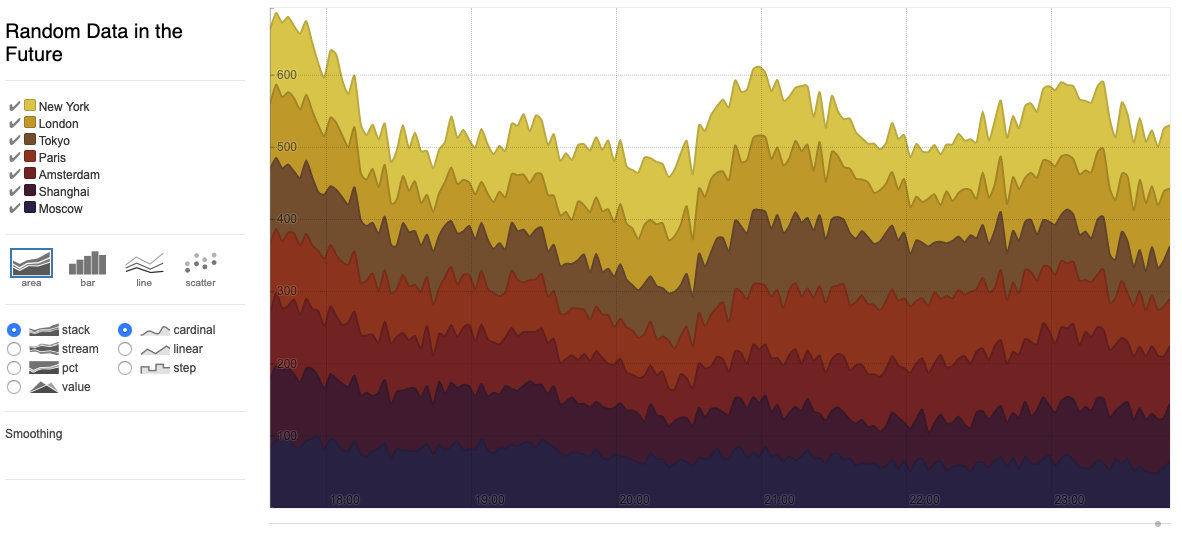
Rickshaw is a JavaScript toolkit for creating interactive time-series graphs. Rickshaw provides the elements you need to create interactive graphs: renderers, legends, hovers, range selectors, etc.
It’s based on d3 underneath, so graphs are drawn with standard SVG and styled with CSS. Customize everything you like with the techniques you already know.
Rickshaw is free and open-source, available under an MIT license. Developed by Shutterstock company.
14. CanvasJS charts
License: Paid. Free licenses for students and Non-Commercial use.
Price: from $149 to $4999
Main dependencies: –
Website: https://canvasjs.com/
CanvasJS is a responsive HTML5 charting library with high performance and a simple API. It supports 30 different chart types (including line, column, bar, area, spline, pie, doughnut, stacked charts, etc.), which are all well-documented. All charts include interactive features like tooltips, zooming, animation, etc. CanvasJS can be integrated with popular frameworks (Angular, React, and jQuery) and server-side technologies (PHP, Ruby, Python, ASP.Net, Node.JS, Java).
15. Koolchart
License: Paid for all users
Price: from $350 to $1280
Main dependencies: –
Website: https://www.koolchart.com/
KoolChart is an HTML5 canvas-based JavaScript charting library. The visuals are clean and modern. The use of canvas offers better performance at the expense of being raster-based.
The API is well documented with example charts for each type. A two-month trial period is available for evaluation. Licensing is required after the trial period expires.
16. Rawgraphs
License: Apache 2.0
Price: Free
Main dependencies: d3.js
Website: https://rawgraphs.io/
RAWGraphs is an open web tool to create custom vector-based visualizations on top of the d3.js library. It was developed by DensityDesign Research Lab (Politecnico di Milano) and Calibro and sustained through corporate stewardship by ContactLab.
It works with tabular data (spreadsheets and comma-separated values) as well as with copied-and-pasted texts from other applications. Based on the SVG format, visualizations can be edited with vector graphics applications for further refinements, or directly embedded into web pages. Here’s an example gallery to explore before diving in.
17. Taucharts
License: Apache 2.0
Price: Free
Main dependencies: d3.js
Website: https://taucharts.com/
TauCharts is one of the most flexible JavaScript charting libraries out there. It is also D3-based and is a data-focused JavaScript charting library that allows for improved data visualization. The library provides a declarative interface for fast mapping of data fields to visual properties. Its architecture allows you to build facets and extend chart behavior with reusable plugins.
Talking about flexibility, TauCharts gives you easy access to their API, thus allowing users to seamlessly map and visualize data to get more amazing insights.
18. Anychart
License: Paid for commercial use
Price: From $49 to $799 to custom price. Free for non-commercial use
Main dependencies: –
Website: https://www.anychart.com/
AnyChart is a robust, lightweight, and feature-rich JS chart library with renderings in SVG/VML. It gives web developers a great opportunity to create different charts that will help them conduct data analysis and make data-driven decisions.
Key Features:
- More than 80 JS chart types, including basic charts, stock charts, maps, as well as Gantt and PERT charts.
- Many ways to set data: XML, JSON, CSV, JS API, Google Sheets, and HTML Table.
- Drill down into chart data.
- Stock technical analysis indicators and drawing tools (annotations) out of the box.
- It can be integrated with Angular, Qlik, Oracle APEX, React, Elasticsearch, Vue.js, Android, iOS, etc.
The watermarked version is free. To get rid of the branding, as well as to use AnyChart for any commercial purpose, it’s necessary to buy a license (starting from $49).
19. Recharts
License: MIT
Price: Free
Main dependencies: d3.js
Website: http://recharts.org/en-US/
Recharts provides a set of modular javascript charting components and does a great job by letting you mix those components to easily build things like a composed line and bar chart.
It is the most popular library to date. There are more than 18k stars on GitHub, but there is a huge number (600 to date) of open issues as well.
The documentation is quite extensive but lacks details in some parts. You can find a bunch of examples on the Recharts website, which could be a good starting point for building your charts.
What’s a bit troubling is the high number of unresolved issues on GitHub. These issues may not be critical, but creators don’t seem to drop by to answer them too often. So if you get stuck, be prepared to dig deep into the library.
Wrapping Up JavaScript Charting Libraries
With charting being something we all need to implement so often now, it’s no great surprise that there are many open-source charting libraries available for us to choose from.
All of the javascript charting libraries we mentioned above have very good browser compatibility and fallbacks available for people using legacy browsers. The libraries built upon D3 have a solid base, but I find them a little bit underwhelming from an aesthetic aspect.
Javascript chart Libraries like FusionCharts, GoogleCharts, Dygraphs, or one of the D3 derivatives may work best for corporations with large data sets, or small businesses that rely heavily on data analysis. Both commercial offerings, Highcharts, and FusionCharts are mature libraries that can fit most use cases very well. Both of them have varying degrees of support for large datasets (>100k data points) and support a large variety of charts. If there is a specific type of chart you need to render, the choice might narrow down to only one of them.
If you just need something small and quick, Morris.js or Chart.js might work better for you. For graphs and networks, Cytoscape, or Sigma.js is probably the way to go.
If you want to stick to a free and open-source library, use Chart.js. It is extremely simple to use for common use cases. If you need a little more control over rendering, then you can look into Chartist.
To select the best JS chart solution for your unique needs, I recommend testing your data against a couple of the libraries listed above to ensure a perfect fit for your current and future projects.
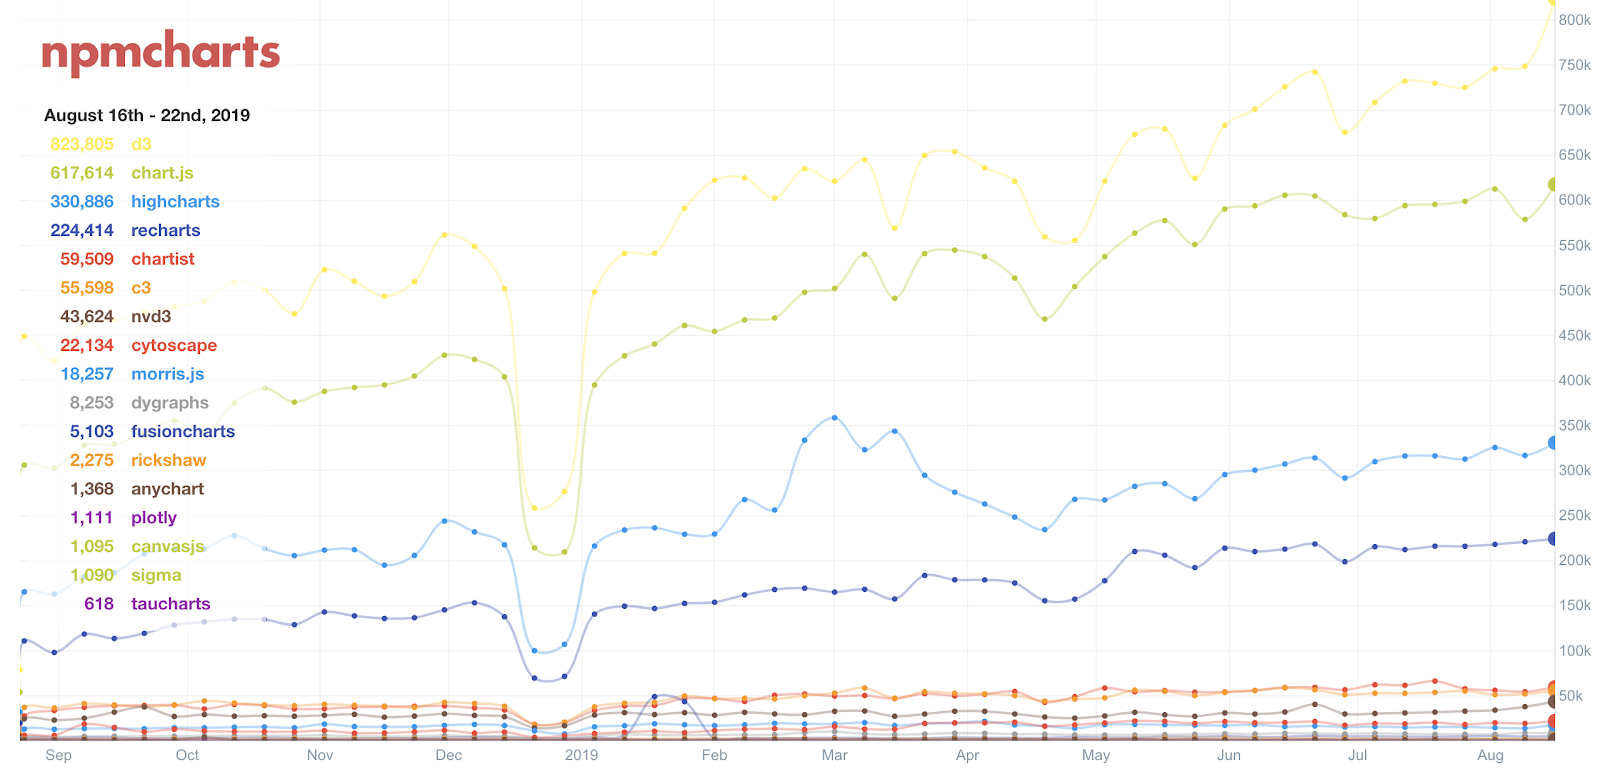
P.S. We have prepared a table to show the popularity of libraries by downloading them through npm. We see that the most popular are d3, chart.js, and Highcharts.
Bonus!
Honorable Mention: Victory
 Victory by Formidable Labs caught our attention after the article originally came out. Normally, charts, templates, libraries, and other tools fall into a specific point of the beginner-pro spectrum. Beginner-friendly entries aren’t very customizable and professional tools aren’t too simple. Occasionally, however, there’s a solution that covers more ground on the spectrum, and each of those is a real treat. Victory is one such example.
Victory is customizable in just about every way an average user would ever think of. The default design is simple and concise but you can change it to something more picturesque if that’s what you’re after. Victory comes with plenty of components and tools that make it worthy of your time. Take a look:
CHARTS
- VictoryBoxPlot
- VictoryArea
- VictoryAxis
- VictoryBar
- VictoryCandlestick
- VictoryChart
- VictoryErrorBar
- VictoryGroup
- VictoryLine
- VictoryPie
- VictoryPolarAxis
- VictoryScatter
- VictoryStack
- VictoryVoronoi
- VictoryHistogram
CONTAINERS
- VictoryBrushContainer
- VictoryContainer
- VictoryCursorContainer
- VictorySelectionContainer
- VictoryVoronoiContainer
- VictoryZoomContainer
- create container
- Common Container Props
MORE
- VictoryAccessibleGroup
- VictoryAnimation
- VictoryBrushLine
- VictoryClipContainer
- VictoryLabel
- VictoryLegend
- VictoryPortal
- VictoryPrimitives
- VictorySharedEvents
- VictoryTheme
- VictoryTooltip
- VictoryTransition
- VictoryCanvas
Build Your Web App with the Flatlogic Platform
We’ve covered the best JS chart libraries and how to make good use of them. Now let’s say a few words about creating complete applications within minutes and with minimal expertise in development. We created a Flatlogic platform to simplify web development to a few choices. Let’s see what they are!
#1: Name Your Project

This is the straightforward part. Pick a name you’ll associate with your project and move on to step two.
#2: Choose Tech Stack
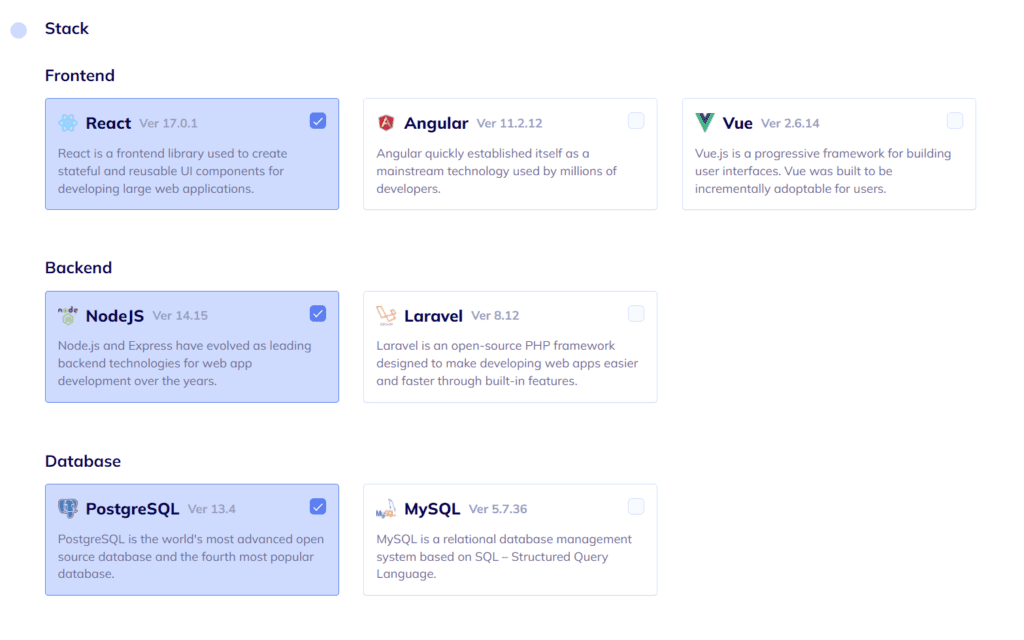
Choose the base technologies your front-end, back-end, and database will run on. In the example above, we chose React, Node.js, and PostgreSQL, respectively.
#3: Choose the Design You Like
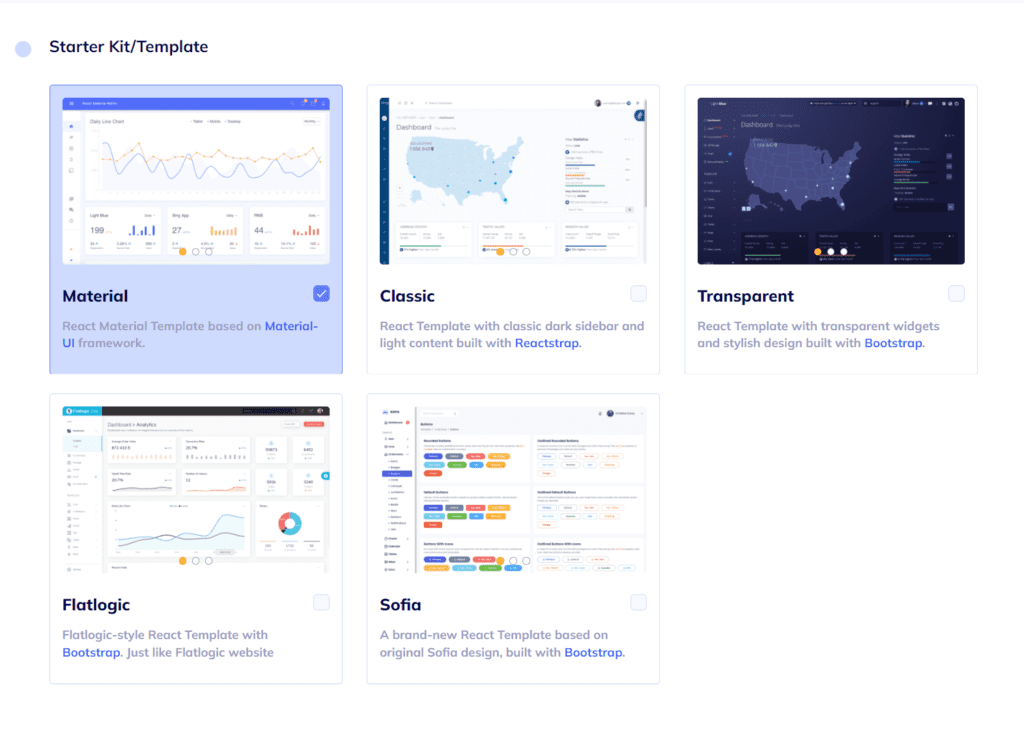
Here you need to choose the design style for the front-end part.
#4: Create Database Schema
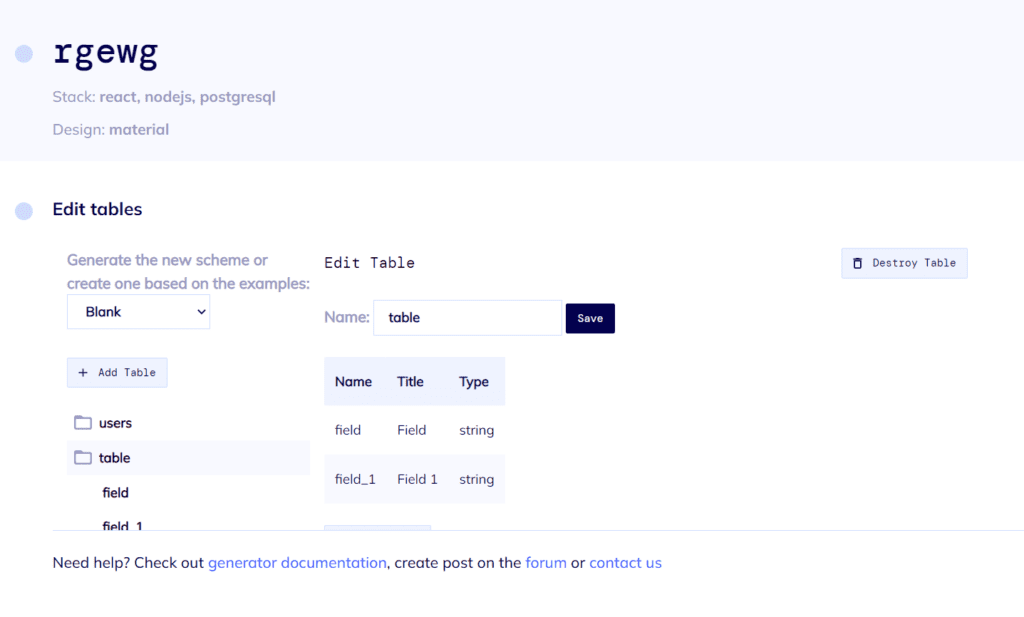
The schema defines how a database functions. We need to define fields, columns, data types, and relationships between all of the above. If that sounds difficult, you can pick one of the free samples given to satisfy popular demands.
#5: Finish the App
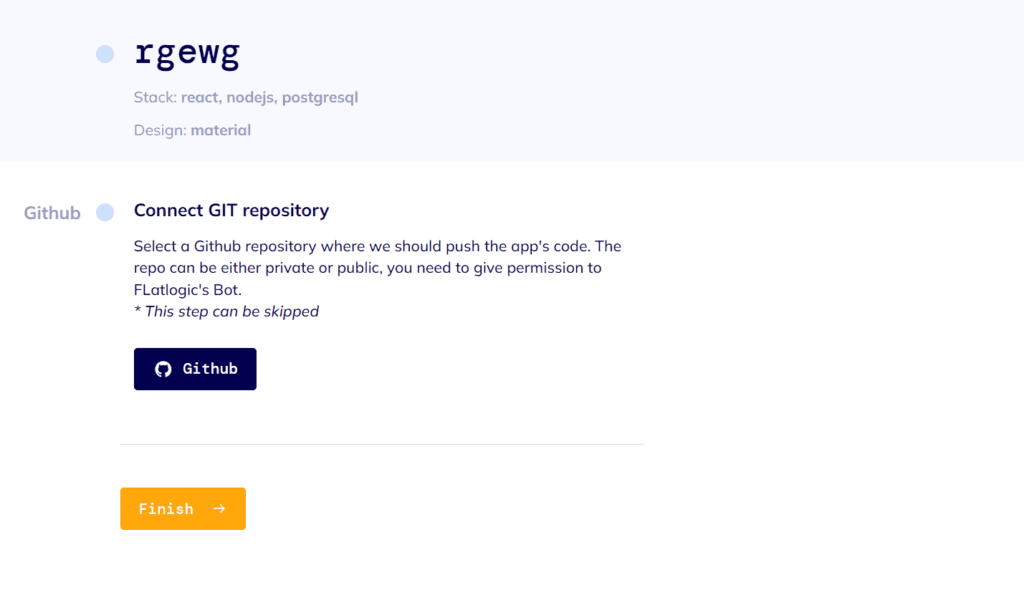
Review the choices made so far. Choose the “Connect GIT repository” checkbox if necessary. Hit “Finish”. After that, the Platform will compile the app and it will be ready in a few minutes.
About Flatlogic
At Flatlogic, we do our best to simplify the process of web app creation. Flatlogic is a platform for building web apps and hosting them, starting from landing pages, static sites, various CMSs, commerce applications, databases, and so on.
We’ve been developing simple but powerful dashboards and admin templates since 2014. We are still one of the leading marketplaces for admin dashboards and templates. We strive to create collective impact and build powerful solutions in the sphere of software development.
Comments